
How Color Measurement Supports Quality Control in Plastic Manufacturing
Introduction
Color is one of the first things a customer notices about a plastic part, and it is one of the hardest things to keep steady in mass production. A housing, a bottle cap, a film or a connector can pass every strength test and still be rejected, either because it does not look like the approved sample or because it clashes with the part it sits beside. Measuring color with an instrument replaces personal opinion with numbers. Those numbers can be recorded, checked against an agreed limit and tracked from batch to batch, shift to shift and plant to plant.
This article shows how that works in practice. It explains how a spectrophotometer (an instrument that measures reflected light) turns what it sees into color numbers, and how the gap between two colors is calculated. It also covers why the way a sample is lit and viewed, and its gloss, matter for plastics; where color checks belong in a production line; what makes color drift during compounding (blending resin with colorants and additives) and molding; and what to look for when choosing an instrument. It is written for quality control staff, process and product engineers, materials scientists, laboratory technicians and technical buyers.
A note on scope. Each standard mentioned here is summarized according to the scope its publisher states. Standards do not all cover every material, product or instrument, and they cannot be swapped for one another. Always work from the latest edition of any document you depend on, and agree the exact requirements with your customers or suppliers.
Why Color Is a Quality Attribute in Plastics
The color of a plastic is not a fixed property. A study of injection molded ABS explains that what we see depends on several things, among them the surface condition of the test piece and the person looking at it [1]. The final color of a product comes from the base polymer, the colorants, any fillers or reinforcing materials, and everything the material went through during processing [2].
A change in color can also act as a warning. Yellowing is the most common color shift in polymers. It can happen when the polymer itself breaks down while it is melted and shaped, or later in use, and it can also be caused by byproducts from additives such as antioxidants [2]. So a reading that moves toward yellow may signal a problem with processing or stability, not only with appearance.
Good color control in plastics therefore depends on three habits. Measure color using a defined method. Compare every result with a written reference and tolerance (the amount of difference you will accept). Record enough about the measuring conditions so that results can be compared later.
How Instrumental Color Measurement Works
From reflected light to color numbers
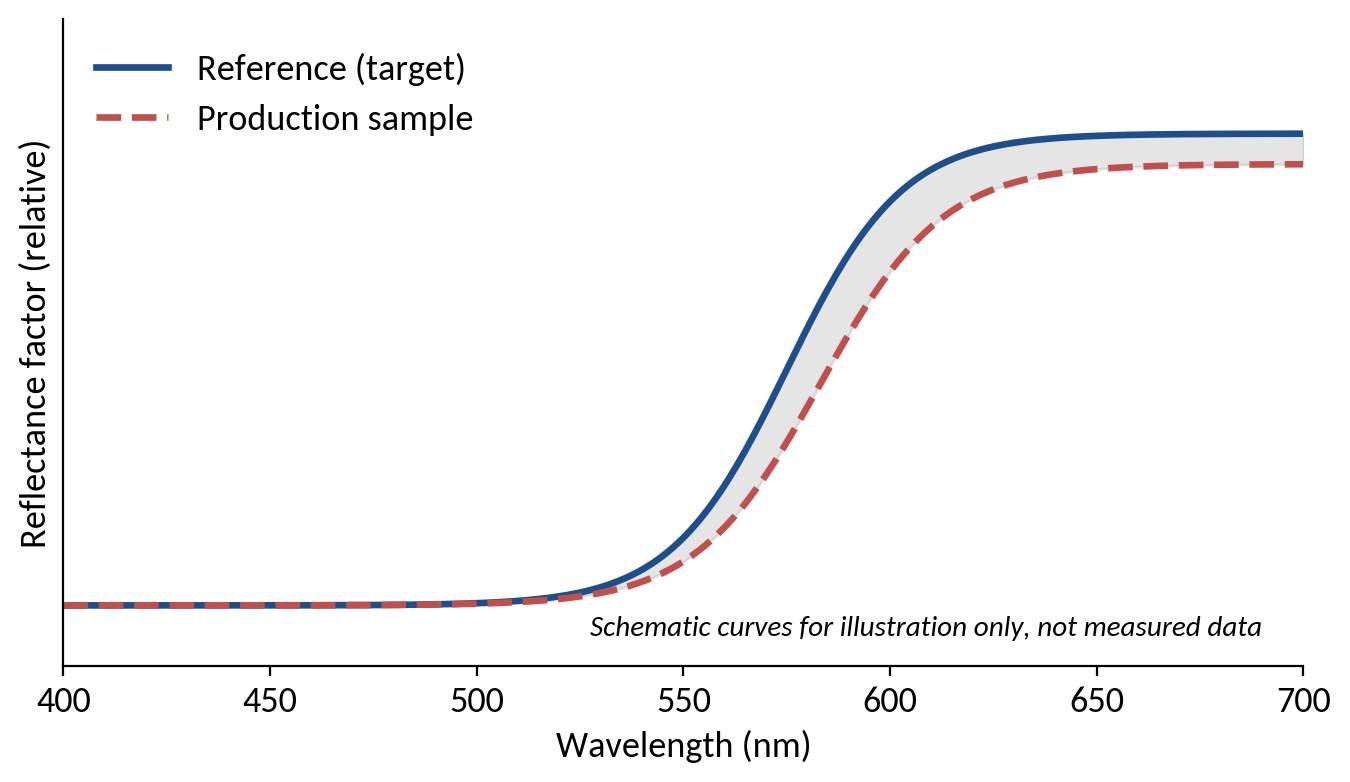
A spectrophotometer shines light on a sample and records how much of it bounces back at each wavelength across the visible range. ASTM E1164 sets out what is needed to collect spectral data good enough for working out the color of an object: the instrument requirements, the calibration steps and the reference materials. It also lists the settings that must be stated whenever a method calls for this type of measurement [3]. The recorded data are then combined with a standard observer from the CIE (the International Commission on Illumination), which is a model of average human color vision, and with a CIE standard illuminant, which is a defined light source. The result is a set of three numbers that describe the color [3].
ASTM E308 explains how to do the math. It turns measured reflectance, transmittance or radiance data into the color values X, Y and Z, and into x and y coordinates that place the color on a standard color chart. It works with either the CIE 1931 standard observer or the CIE 1964 supplementary observer, and it also gives the steps for converting results to CIELAB and CIELUV, two standard color scales [4]. The CIE's own publication on colorimetry (the science of measuring color) lays out the thinking behind these calculations. It covers standard observers and illuminants, the reference standard used for reflectance, the lighting and viewing conditions, and how to calculate color scale coordinates and color differences [5].
CIELAB coordinates
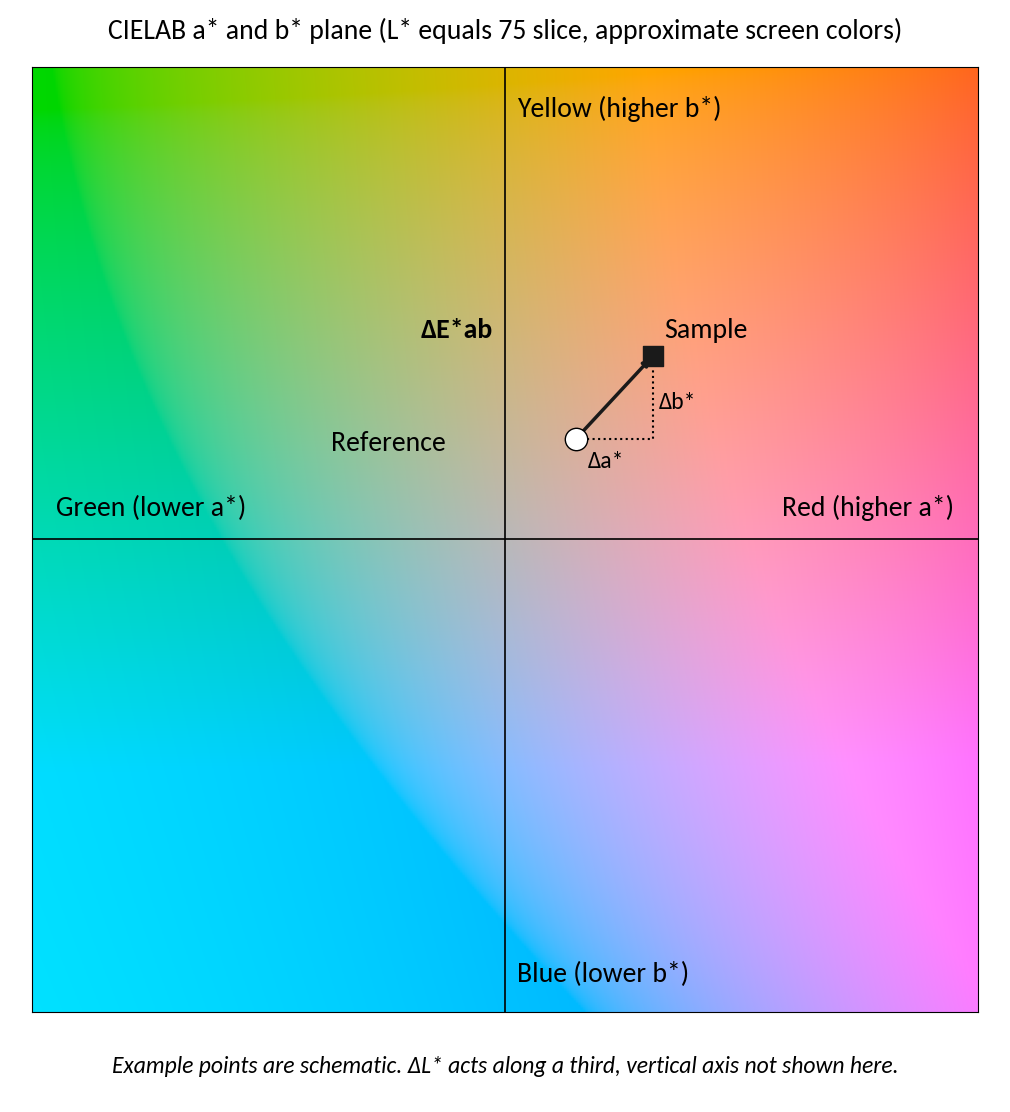
Most color work in plastics quality control is reported in the CIE 1976 L*a*b* color space, usually called CIELAB. ISO/CIE 11664 Part 4 explains how to calculate its coordinates, including measures of lightness, color strength (chroma) and hue. It also describes two ways to calculate the straight line distance between two colors in this space, which stands for how large the difference looks to the eye [6]. In simple terms, L* shows lightness from black to white, a* runs from green to red, and b* runs from blue to yellow [2].
The gap between a sample and its reference is called the total color difference, written ΔE*ab and often said as delta E. It is made up of three smaller differences: ΔL*, Δa* and Δb* [2]. A single ΔE number tells you how big the gap is, but not which way the color has moved. When the three parts are reported as well, an engineer can see whether a batch is lighter, redder or yellower than the reference. That is the information needed to adjust a formulation or a machine setting.
Color Spaces and Color Difference Formulas
The CIELAB distance is not the only way to state a color difference. ISO/CIE 11664 Part 6 defines the CIEDE2000 formula, which builds on the CIELAB difference and adds corrections so that the result matches more closely how large the difference looks to people [7]. ASTM D2244 explains how to calculate color tolerances and small color differences between opaque (not see through) samples such as painted panels, flat plastic test plates or fabric swatches. It names CIELAB, CMC, CIE94, DIN99o and CIEDE2000 as the units in which those differences can be expressed [8].
| Quantity | What it describes | Typical use in quality control | Source |
|---|---|---|---|
| L*, a*, b* | Lightness, plus two color axes (green to red and blue to yellow) | Describing a color as three numbers measured against a reference | [6] |
| ΔE*ab | Straight line distance between two points in CIELAB | One number showing the size of a difference, but not its direction | [6] [2] |
| CIEDE2000 | A CIELAB based formula with corrections that match visual judgment more closely | Small differences where agreement with the human eye matters | [7] |
| CMC, CIE94, DIN99o | Other difference formulas named in ASTM D2244 | Used when a customer or test method asks for them | [8] |
| Yellowness index | A one number yellowness scale for white, nearly white or colorless samples | Resin whiteness, heat and UV stability studies | [9] [10] |
Table 1. Common color measures used in plastics quality control.
One rule matters more than any formula. ASTM D2244 says that color differences should only be compared when they come from the same color scale [8]. A tolerance of a certain size in one formula is not the same demand as a tolerance of that size in another formula. For this reason, the formula must be written into every specification.
Measurement Geometry and Gloss (SCI and SCE)
Geometry means how a sample is lit and how the light coming back from it is collected. The CIE publication on colorimetry deals with lighting and viewing conditions [5], and ASTM E1331 covers color measurement with a half dome (hemispherical) optical system such as an integrating sphere, a hollow ball coated inside to spread light evenly [11]. In an instrument built around a sphere, the shiny mirror reflection from the surface, called the specular component, can be counted in the reading, which is known as SCI (specular component included), or left out of it, which is known as SCE (specular component excluded).
This choice matters most for glossy plastics. ASTM E1331 advises that for flat, high gloss samples the specular component should generally be left out. For flat matte samples it can be left out or counted, and the results will not differ much [11]. If you are unsure, the standard suggests taking both readings and comparing them with what people see. When two samples with clearly different gloss or texture are compared, it generally advises counting the specular component in both readings [11].
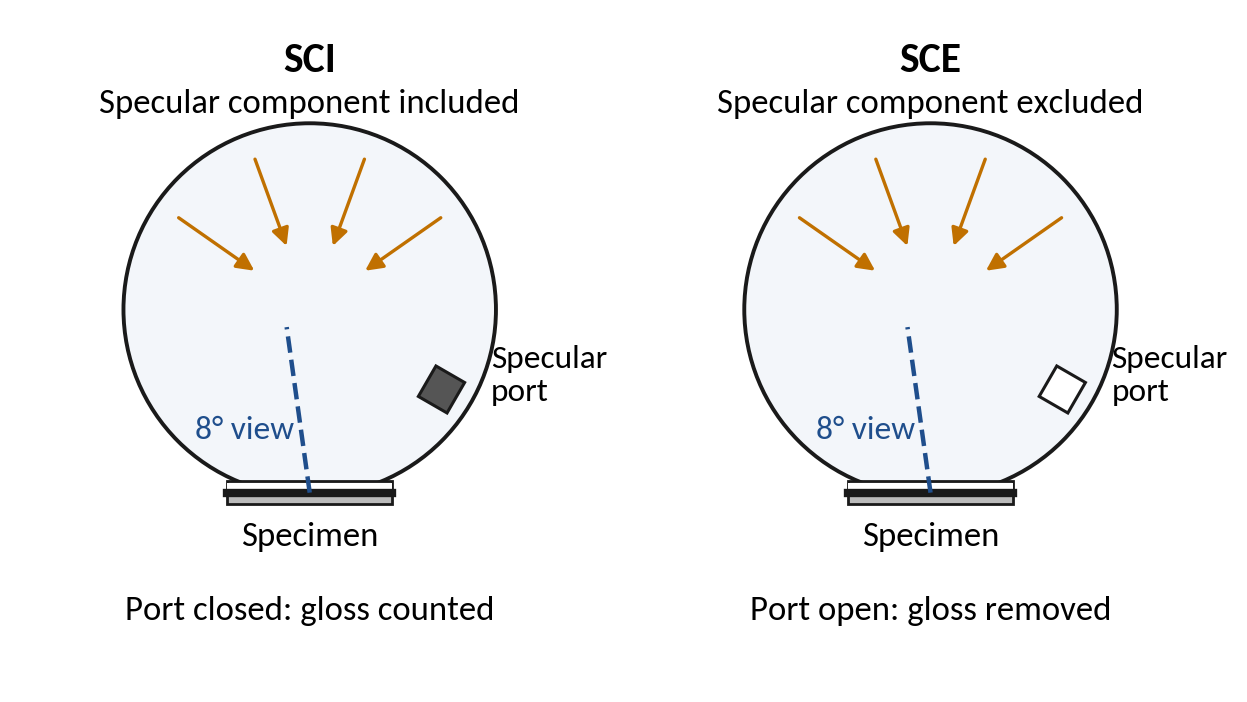
Gloss does not depend on the material alone. In the ABS study mentioned earlier, the gloss of molded parts changed with the mold temperature and the injection temperature. The authors also report that both gloss and color were affected by processing conditions [1]. A laboratory should therefore note which specular mode it used, use it the same way every time, and never mix SCI and SCE results on one trend chart.
Where Color Measurement Fits in a Plastics Production Workflow
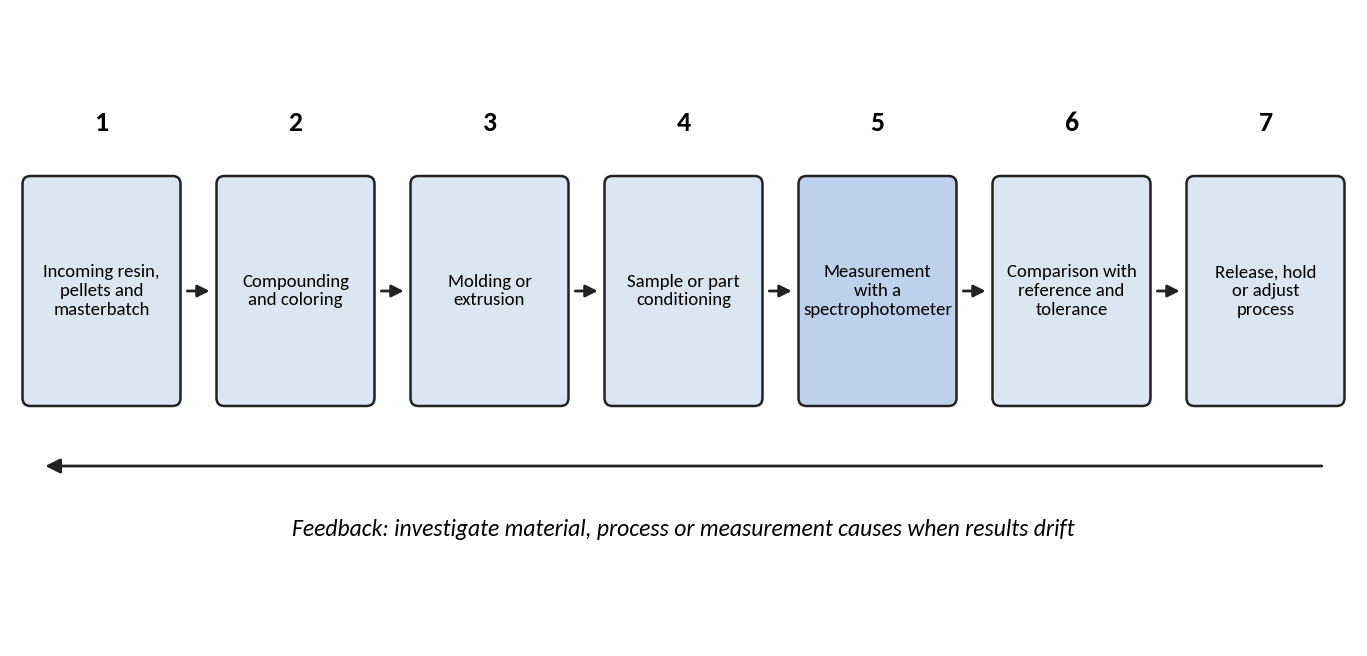
Color checks can be placed at several points between raw material and shipment. Figure 4 shows a typical sequence. The sections after it describe what happens at the main stages and what the cited standards and studies say about each one.
Incoming resin and pellets
ASTM D6290 covers color testing of plastic pellets. Results can be reported as yellowness index, color values (X, Y and Z) or CIE L*a*b* coordinates [12]. It is presented as a quick way to compare resins in pellet form, because there is no need to mold or extrude test pieces first. It should only be used to compare pellets that are similar in shape, size, texture and translucency (how much light passes through) [12]. The method also says that any sample preparation or testing rules in the material specification come first, and that it is not meant for general material specifications [12].
Compounding and coloring
At the compounding stage, the key question is whether the colorant system delivers the intended color every time. In the ABS study, parts colored with masterbatch (a concentrated pellet blend of pigment in resin) differed less from the chosen reference than parts colored with loose powder pigment, even though the molding conditions were the same. The authors suggest that the pigment spreads out better in the masterbatch, which may explain this [1]. The result applies to one pigment, one polymer and one set of conditions. It is a useful example of how the form of a colorant can affect results, not a general rule.
Molded and extruded parts
ASTM D2244 specifically lists flat plastic test plates among the opaque samples whose small color differences it covers [8]. Published studies show how measuring spots can be chosen. In the ABS gloss and color study, color was measured at three points along each molded bar, numbered in the direction the material flowed. The differences between the three points on one sample were small, so the values were averaged [1]. In the ABS and titanium dioxide study, readings were taken at three points on each of three plates for every material and treatment, which gave nine data points [2].
Aging and stability checks
ISO 17223 gives an instrument based method for finding the yellowness index, and the change in yellowness index, of clear, translucent or opaque plastics. It notes that the change in yellowness index is often used to judge how heat or UV light affects color stability [10]. In the heat aging study, ABS plates with different levels of titanium dioxide were aged at temperatures between 60 and 100 °C. Their color was tracked with CIELAB measurements for 800 hours, and the authors used the results to build a model of long term color change [2].
Sources of Color Variation in Plastic Manufacturing
A measured color difference has two parts: real differences in the product, and differences added by the way it was molded, prepared and measured. Telling these two parts apart is the main skill in solving color problems.
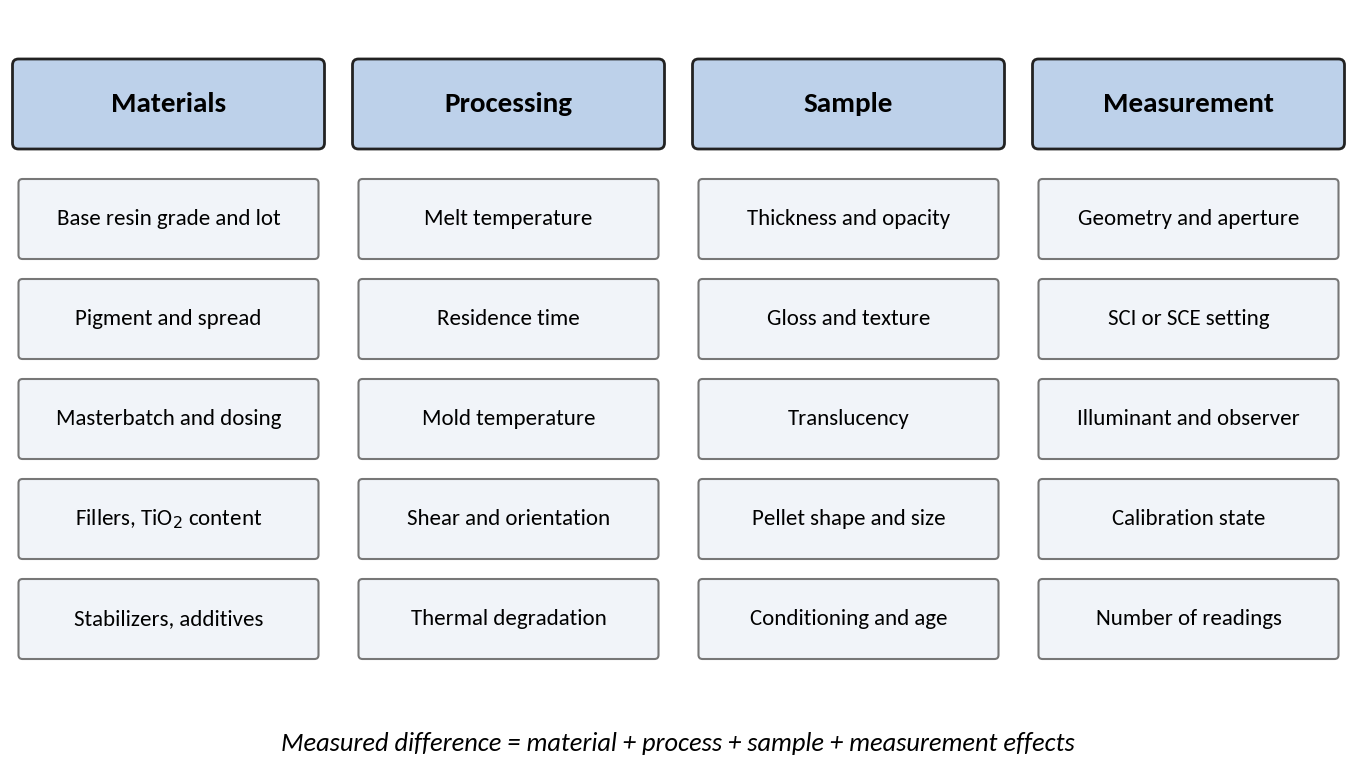
| Factor | Possible effect on measured color | Evidence |
|---|---|---|
| Melt temperature and residence time (how long the melt stays hot) | Heat damage can turn the polymer yellow, and byproducts from additives can also cause yellowing | [2] |
| Mold and injection temperature | In the ABS study with a yellow pigment, a higher mold temperature combined with a lower injection temperature gave higher gloss and less color variation | [1] |
| Colorant form and spread of the pigment | Parts colored with masterbatch showed smaller color differences than parts colored with powder pigment in the same study. Better pigment spread was suggested as a reason | [1] |
| Titanium dioxide content | In ABS plates exposed to heat, color retention stopped improving above roughly 3 wt% TiO2 | [2] |
| Polymer orientation | The authors suggest that the way the polymer lines up in the surface layer may add to color variation along the flow path | [1] |
| Gloss and texture | They affect the measured color and the choice of specular mode, and they change how well a measured difference predicts whether a color will be accepted | [11] [8] |
| Thickness and translucency | Samples being compared should have broadly similar gloss and texture and, if they are not opaque, similar thickness and translucency | [9] |
Table 2. Factors that can influence measured color in plastics, with the source for each point.
The numbers reported in these studies apply only to the specific materials, pigments and conditions that were tested. They show which variables deserve attention, but they are not settings to copy into any process. Each plant should work out its own link between process variables and color for every material and colorant system it uses.
Yellowness Index and Whiteness for Nearly White and Clear Plastics
For white, nearly white or colorless materials, one number is often more useful than three coordinates. ASTM E313 gives calculations that produce numbers matching how people rate yellowness or whiteness in white, nearly white or colorless objects, and it names plastics among the materials that can be described this way [9]. It also points out that it does not cover how samples are prepared, even though preparation can change the results a great deal. It adds that samples being compared should have broadly similar gloss, texture and, if they are not opaque, similar thickness and translucency [9].
ISO 17223 is the method written specially for plastics to find yellowness index and its change [10], and ASTM D6290 applies the same kind of measurement to pellets [12]. Each document has its own scope. A laboratory that reports yellowness index should therefore say which method and which edition it followed, and should not assume that results from different methods can be swapped.
Setting Tolerances and Pass/Fail Criteria
A tolerance turns a measurement into a decision. ASTM D2244 says that each material and each use may need its own color tolerances. The reason is that other things we see, such as nearby colors, gloss and texture, change how well a measured difference predicts whether a customer will accept the product [8]. It also says that tolerances set from instrument readings should be checked carefully against what people see in terms of hue (the shade), lightness and saturation (color strength) [8].
Published numbers should be used as reference points only. The ABS and titanium dioxide study quotes a figure of about 2.3 CIELAB units from other literature as the smallest difference the eye can just notice. It uses a maximum allowed deviation of 5 purely as an example in a case study that demonstrates its modeling method [2]. Neither value is a general acceptance limit. Whether a difference can be seen depends on the color, the viewing conditions and the person looking, and the authors of the ABS gloss and color study also note that color perception depends on several factors [1].
A complete tolerance specification should state the following:
- the reference, which can be a physical standard or target numbers;
- the color space and difference formula, and whether the limits apply to ΔE alone or to each component [8];
- the illuminant and observer used in the calculation [4];
- the instrument geometry, the specular mode (SCI or SCE) and the measuring aperture (opening) [11];
- the sample type, thickness, surface condition and measuring spots;
- the number of readings averaged for each sample and how unusual readings are handled [13].
Repeatability, Calibration and Sampling
An instrument can only support a tight tolerance if its own variation is small compared with that tolerance. ASTM E1345 explains how to cut down the variation in average color or color difference results by using statistics on repeated readings of one sample or on readings from several samples. It also gives a way to work out how many readings are needed to bring the variation down to a chosen fraction of the tolerance [13]. The practice is general. It is not tied to any particular instrument or material [13].
Calibration is the second foundation of reliable readings. Calibration steps and reference materials are among the topics covered by ASTM E1164 [3]. How often to calibrate, and which standards to use for a given instrument, should come from the manufacturer's documents and the laboratory's quality system and should never be guessed.
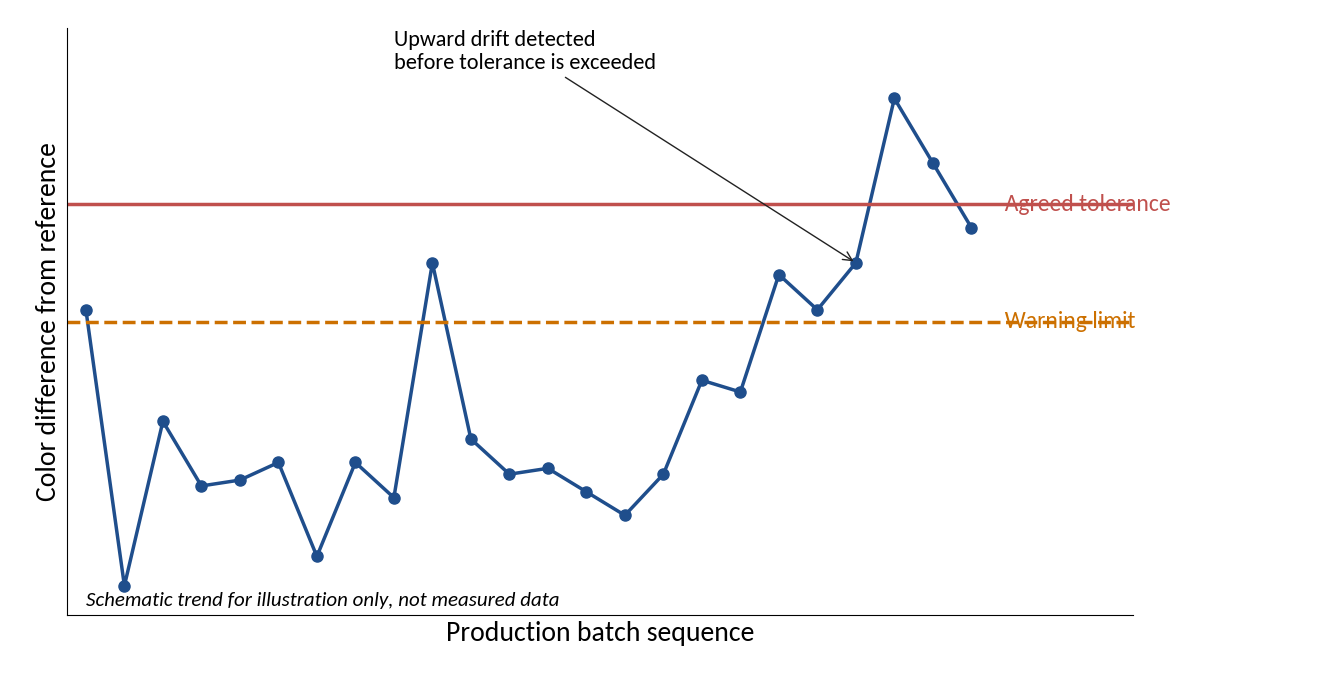
Published studies show why averaging matters. In the ABS and titanium dioxide work, the largest standard deviation (a measure of spread) across the nine measuring points of a material was 3.3 for L*, and for that reason the authors used averaged values [2]. In the ABS gloss and color study, the differences between measuring points on one sample ranged from 0.01 to 0.29, and the values were averaged before further calculation [1]. How much readings vary within one sample depends on the material, the sample and the method, so each laboratory should measure its own.
Sample Preparation and Presentation
Many color problems that seem real are really problems of presentation. A thin or translucent sample lets light pass through that a thick one would block. A textured surface scatters light differently from a polished one. A pellet is also a very different target for the instrument than a flat plate. For this reason ASTM D6290 limits pellet comparisons to pellets of similar shape, size, texture and translucency [12], and ASTM E313 makes the same point for yellowness and whiteness comparisons [9].
Where you measure also matters. In molded parts, color can change along the path the melt takes, and the ABS study links part of this to the alignment of the polymer in the surface layer and to how the material flowed in the mold [1]. Stating where on a part or plate the reading is taken, in relation to the gate (the mold entry point) or the flow direction, removes one source of disagreement between laboratories and shifts.
Neither the method nor the instrument can make up for a sample that does not represent the product. The sample type, how it is conditioned (kept under set conditions before testing) and where it is measured should be defined in the test procedure or the customer specification.
Metamerism and Choosing the Light Source
Two samples can look the same under one light source and different under another if their spectral curves are not the same. This effect is called metamerism. ASTM D4086 describes visual methods for spotting metamerism and estimating how strong it is. It deals only with metamerism caused by the light source and by the observer. It does not cover samples whose color shifts with viewing angle (gonioapparent samples, such as metallic or pearl finishes), and it does not cover calculating metamerism indices from instrument data [14]. ASTM D2244 adds that where samples may show metamerism, ASTM D4086 should be used to check the instrument results [8].
Spectral measurement helps here because color values come from combining the sample's spectral data with a chosen standard observer and illuminant [3]. The same data can therefore be recalculated for different illuminants and observers. ASTM E308 supplies standard values for six CIE standard illuminants and three recommended fluorescent illuminants. It also supplies weighting values for nine CIE standard or recommended LED illuminants, each combined with the two standard observers [4]. When colorants from different suppliers must match, it is wise to check more than one illuminant and to confirm the result by eye.
How to Read a Spectrophotometer Specification: The TS-SP500 Example
This section looks at one Testshine instrument. The values below come from the official TS-SP500 product page as viewed on 21 October 2026 [15]. They are statements made by the manufacturer and were not tested independently for this article. The table shows how to link published specifications to the questions raised earlier.
| Specification | Published value | Why it matters in plastics quality control |
|---|---|---|
| Optical geometry | di:8°, de:8° with a 48 mm integrating sphere | Sets how the sample is lit and viewed, and links to the SCI and SCE discussion [11] |
| Specular component | SCI and SCE | Lets both modes be recorded for glossy and matte parts |
| Wavelength range and interval | 400 to 700 nm at 10 nm | The 10 nm interval is one of the intervals that ASTM E308 accepts for its tables [4] |
| Illuminants and observers | D65, A, C, D50, D55, D75 and F1 to F12; 2° and 10° | Supports checks with different light sources to look for metamerism |
| Color spaces | CIE Lab, XYZ, Yxy, LCh, CIE LUV, Hunter Lab | Matches the color space named in a customer specification |
| Color difference formulas | ΔE*ab, ΔE*uv, ΔE*94, ΔE*cmc (2:1 and 1:1), ΔE*00v, ΔE (Hunter) | The formula must match the one used in the tolerance [8] |
| Measuring apertures | Dual aperture, 10 mm/8 mm and 5 mm/4 mm | Sets the smallest uniform area that can be measured |
| Repeatability | MAV/SCI: ΔE*≤0.03 (stated by the manufacturer) | Confirm the test conditions and compare the figure with a fraction of the tolerance [13] |
| Error between instruments | MAV/SCI: ΔE*≤0.15 (stated by the manufacturer) | Matters when several instruments or sites share one specification |
| Measuring time and data | About 2.6 s; PASS/FAIL display; USB and Bluetooth 4.0 | Affects how many samples can be tested and how records are kept |
Table 3. Selected published specifications of the Testshine TS-SP500 spectrophotometer [15].
The product page lists plastics among the industrial uses the instrument is designed for, together with printing, ink, textiles, electronics and ceramics [15]. A buyer who needs proof of conformity to a particular standard for a contract or a regulated purpose should ask the supplier for supporting documents, because each standard defines its own scope.
How to Select a Spectrophotometer for Plastics Quality Control
Start with the application. Incoming pellets, molded test plates, finished parts of different sizes and aging studies each put different demands on an instrument. The criteria below apply to any manufacturer.
| Criterion | Questions to ask | Reference point |
|---|---|---|
| Geometry and specular mode | Does the instrument offer the geometry and the SCI or SCE mode that the customer specification requires? | [11] |
| Aperture and sample size | Is the measuring area smaller than the uniform area of the smallest sample or part? | Depends on the application |
| Spectral range and interval | Does the range cover the visible spectrum, and does the interval suit the calculation method? | [4] |
| Illuminants, observers, formulas | Are the illuminants, observers, color spaces and difference formulas named in your specifications available? | [8] [7] |
| Repeatability and agreement | Under what conditions are the repeatability and instrument to instrument agreement values stated, and how do they compare with the tolerance? | [13] |
| Calibration | What calibration procedure and reference standards are provided, and how are they documented? | [3] |
| Data handling | Can results, method settings and pass or fail outcomes be stored and exported for traceability? | Quality system |
| Environment and ease of use | Do the operating conditions in the laboratory or on the shop floor fall within the limits the manufacturer states? | Instrument documentation |
| Documentation and service | Are the user guide, software, calibration certificates and service arrangements adequate? | Supplier documentation |
Table 4. Instrument selection criteria for plastics color control.
A Practical Color QC Checklist
- Write down the reference, color space, difference formula, illuminant, observer, geometry and specular mode.
- Set out the sample type, thickness, surface condition, conditioning and measuring spots.
- Calibrate as the instrument documents describe, before each measuring session or as often as the quality system requires.
- Take enough readings on each sample to bring variation within a fraction of the tolerance, using a method such as the one in ASTM E1345 [13].
- Record the component differences (ΔL*, Δa*, Δb*) as well as the total difference.
- Chart results batch by batch and look into any drift before a tolerance is exceeded.
- When a result is disputed, check how the sample was presented and which specular mode was used before deciding that the material has changed.
- Confirm by eye any decision that rests on a small instrument difference or a possible case of metamerism [8].
Frequently Asked Questions
What does ΔE mean, and what value is acceptable?
ΔE is the distance between two colors in a color space such as CIELAB [6]. No single value is acceptable everywhere. Tolerances depend on the material and how it is used, and they should be checked against what people see [8].
Why can two spectrophotometers give different readings on the same part?
Differences in geometry, specular mode, aperture, calibration, sample presentation and difference formula can all play a part. Standards cover geometry and calibration in detail [11] [3], and a shared specification should fix as many of these variables as possible.
Should I use SCI or SCE for a glossy plastic?
ASTM E1331 generally advises leaving out the specular component for flat, high gloss samples. When in doubt, it advises taking both readings and comparing them with what people see [11]. Always follow any requirement in the customer specification.
Can color be measured on pellets?
Yes. ASTM D6290 covers plastic pellets, but results should only be compared between pellets of similar shape, size, texture and translucency [12].
How many readings should be taken per sample?
There is no single answer. ASTM E1345 gives a way to work out how many readings are needed to reduce variation to a chosen fraction of the tolerance [13].
Can the same instrument report yellowness index?
Yellowness index is calculated from measured color coordinates by a defined method such as ASTM E313 or ISO 17223 [9] [10]. Check that the instrument and its software support the method your specification names.
Can a spectrophotometer detect metamerism?
Spectral data can be recalculated for different illuminants and observers [3] [4], which helps reveal differences that appear only under certain light sources. ASTM D2244 recommends checking suspected cases of metamerism with ASTM D4086 [8] [14].
Conclusion
Color measurement supports quality control in plastics when it is treated as a controlled method and not as a single number. The method has to define the reference, the color space and formula, the illuminant and observer, the geometry and specular mode, the sample and the number of readings. Once these are fixed, results can be charted over time, compared between sites and traced back to causes in the material and the process, such as heat damage, pigment spread, mold conditions and surface finish.
The research cited here shows that processing conditions and colorant systems can change color and gloss. Its numbers belong to the specific materials tested, though, and should not be copied into other plants as settings. The practical path is to adopt the standards that suit the product, record every measuring condition, measure the laboratory's own variation, and confirm borderline decisions by eye.
Relevant Testshine Product
Check Color Consistency with the Testshine TS-SP500 Spectrophotometer
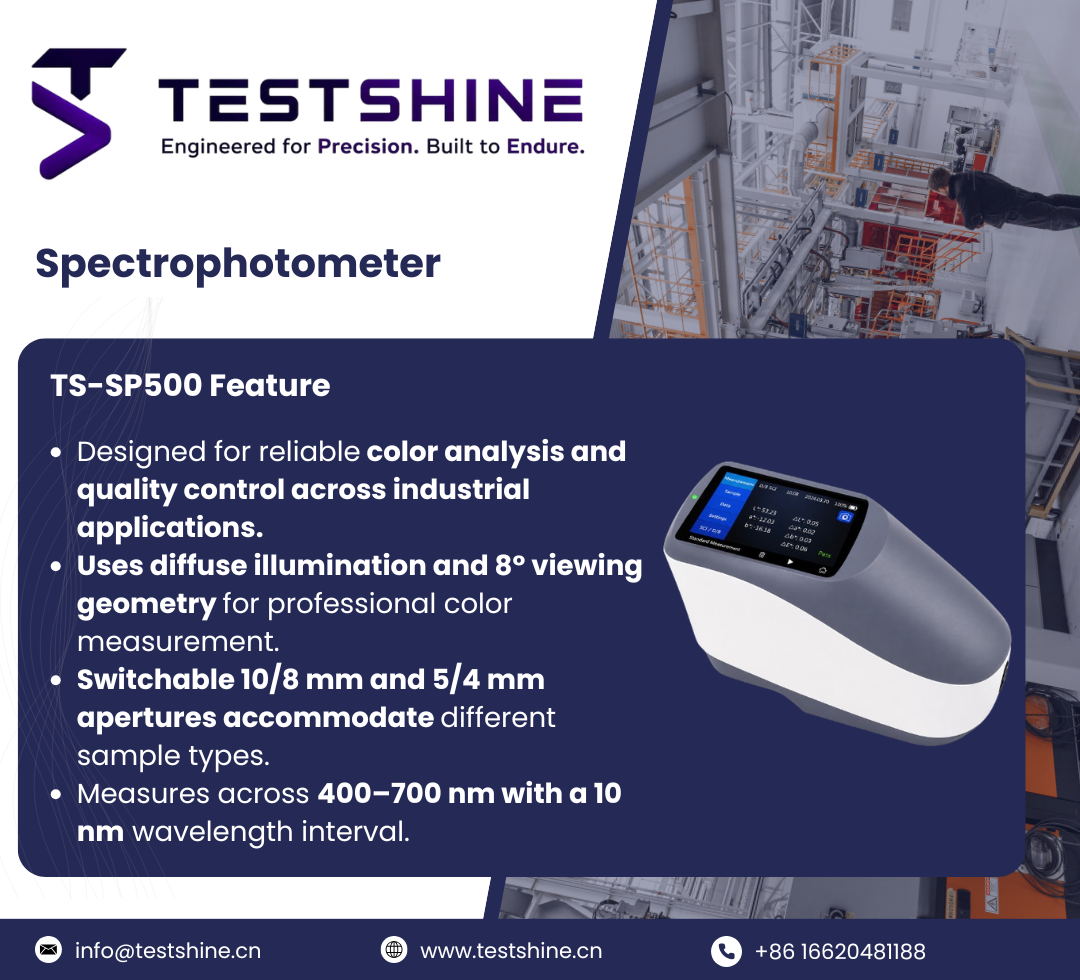
The color control practices in this article rely on an instrument that can record spectral data, report the color space and difference formula named in your specification, and measure with a defined geometry and specular mode. The Testshine TS-SP500 Spectrophotometer is presented as a color measurement instrument for quality control in printing, ink, textiles, plastics, electronics, ceramics and other industries.
Why it may fit your application:
- Diffuse illumination optics. Published as di:8° and de:8° with a 48 mm integrating sphere and SCI and SCE specular components, which ties in with the specular mode discussion above.
- Spectral data and color formulas. A 400 to 700 nm range at 10 nm intervals, illuminants including D65, A and F1 to F12, 2° and 10° observers, and color difference formulas including ΔE*ab, ΔE*94 and CMC.
- Two measuring apertures. 10 mm/8 mm and 5 mm/4 mm, for different sample sizes.
- Stated repeatability. MAV/SCI ΔE*≤0.03, as stated by the manufacturer, with PASS/FAIL result display and USB and Bluetooth data ports.
The TS-SP500 suits laboratories and production sites that need documented, repeatable color data for plastics and related materials. Before you buy, confirm that the published specifications and conditions match your test method.
References
-
E. Bociąga and M. Trzaskalska, "Influence of polymer processing parameters and coloring agents on gloss and color of acrylonitrile butadiene styrene terpolymer moldings," Polimery, vol. 61, no. 7 and 8, pp. 544 to 550, 2016. DOI: 10.14314/polimery.2016.544. https://dx.doi.org/10.14314/polimery.2016.544
-
Á. D. Virág, A. Suplicz and D. Török, "Prediction of the thermal degradation induced colour change of acrylonitrile butadiene styrene products as a function of temperature and titanium dioxide content," Results in Engineering, vol. 24, article 103505, 2024. DOI: 10.1016/j.rineng.2024.103505. https://doi.org/10.1016/j.rineng.2024.103505
-
ASTM International, "Standard Practice for Obtaining Spectrometric Data for Object Color Evaluation," ASTM E1164, 2023 edition. View source online
-
ASTM International, "Standard Practice for Computing the Colors of Objects by Using the CIE System," ASTM E308, 2022 edition. View source online
-
International Commission on Illumination (CIE), "Colorimetry, 4th Edition," CIE 015:2018, Vienna, 2018. DOI: 10.25039/TR.015.2018. View source online
-
ISO/CIE, "Colorimetry, Part 4: CIE 1976 L*a*b* colour space," ISO/CIE 11664 Part 4:2019, Edition 1, June 2019. https://www.iso.org/standard/74166.html
-
ISO/CIE, "Colorimetry, Part 6: CIEDE2000 colour difference formula," ISO/CIE 11664 Part 6:2022, Edition 2, August 2022. https://www.iso.org/standard/82662.html
-
ASTM International, "Standard Practice for Calculation of Color Tolerances and Color Differences from Instrumentally Measured Color Coordinates," ASTM D2244, 2025 edition. View source online
-
ASTM International, "Standard Practice for Calculating Yellowness and Whiteness Indices from Instrumentally Measured Color Coordinates," ASTM E313, 2020 edition. View source online
-
ISO, "Plastics: Determination of yellowness index and change in yellowness index," ISO 17223:2026, Edition 2, April 2026. https://www.iso.org/standard/91100.html
-
ASTM International, "Standard Test Method for Reflectance Factor and Color by Spectrophotometry Using Hemispherical Geometry," ASTM E1331, 2015 edition, reapproved 2023. View source online
-
ASTM International, "Standard Test Method for Color Determination of Plastic Pellets," ASTM D6290, 2019 edition. View source online
-
ASTM International, "Standard Practice for Reducing the Effect of Variability of Color Measurement by Use of Multiple Measurements," ASTM E1345, 2024 edition. View source online
-
ASTM International, "Standard Practice for Visual Evaluation of Metamerism," ASTM D4086, 2018 edition, reapproved 2023. View source online
-
Testshine Co., Ltd., "Spectrophotometer TS-SP500," official product page, accessed 21 October 2026. View source online