How DSC Helps Study Polymer Crystallization Behavior
Introduction
Many everyday plastics are semicrystalline. They contain tidy, tightly packed crystal regions sitting next to loose, disordered regions. The balance between the two, and how quickly the crystal regions form as the material cools, strongly shapes how a plastic part performs once it comes out of the mould, extruder or film line. Differential scanning calorimetry (DSC) is one of the most widely used techniques for studying this, because both crystallizing and melting give off or take in a measurable amount of heat.
ISO 11357-1 lays out the general rules for running DSC on polymers, covering the principle, equipment, sampling, calibration, procedure and reporting shared by every part of the ISO 11357 series. The series applies to polymers and polymer blends, including thermoplastics (plastics that soften when heated), thermosets (plastics that set permanently) and elastomers (rubbery materials), with or without fillers or reinforcements. It also covers physical changes such as glass transition, melting and crystallization [1]. Within that framework, ISO 11357-3 deals with the temperatures and heat amounts involved when crystalline or partly crystalline plastics melt and crystallize [2], and ISO 11357-7 deals with how fast crystallization happens [3].
This article explains what DSC can and cannot tell you about polymer crystallization. It walks through the events visible on a DSC curve, the two main ways of running a test (changing the temperature or holding it steady), how crystallinity is estimated, what can change your results, the relevant standards, and practical advice on choosing a method and an instrument. It is written for laboratory staff, quality control engineers, researchers and product development teams.
Understanding Polymer Crystallization
Semicrystalline structure and the thermal events involved
When a molten semicrystalline polymer cools, its chains start to pack together into ordered crystals. This happens in two stages, where crystals first start to form and then grow, a process described mathematically by classical phase change theory [4]. Not every chain joins a crystal, and the rest stay disordered (amorphous). The resulting material has properties that depend on how much of it is crystalline and on the conditions under which the crystals formed.
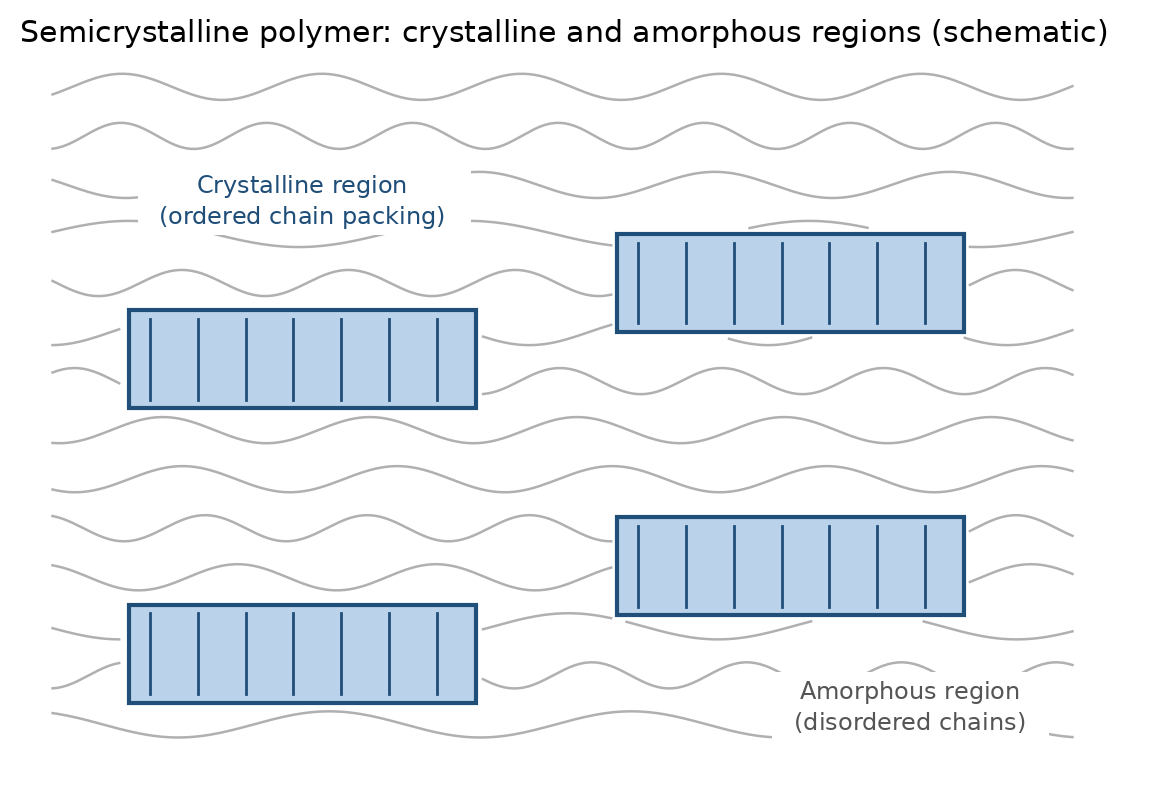
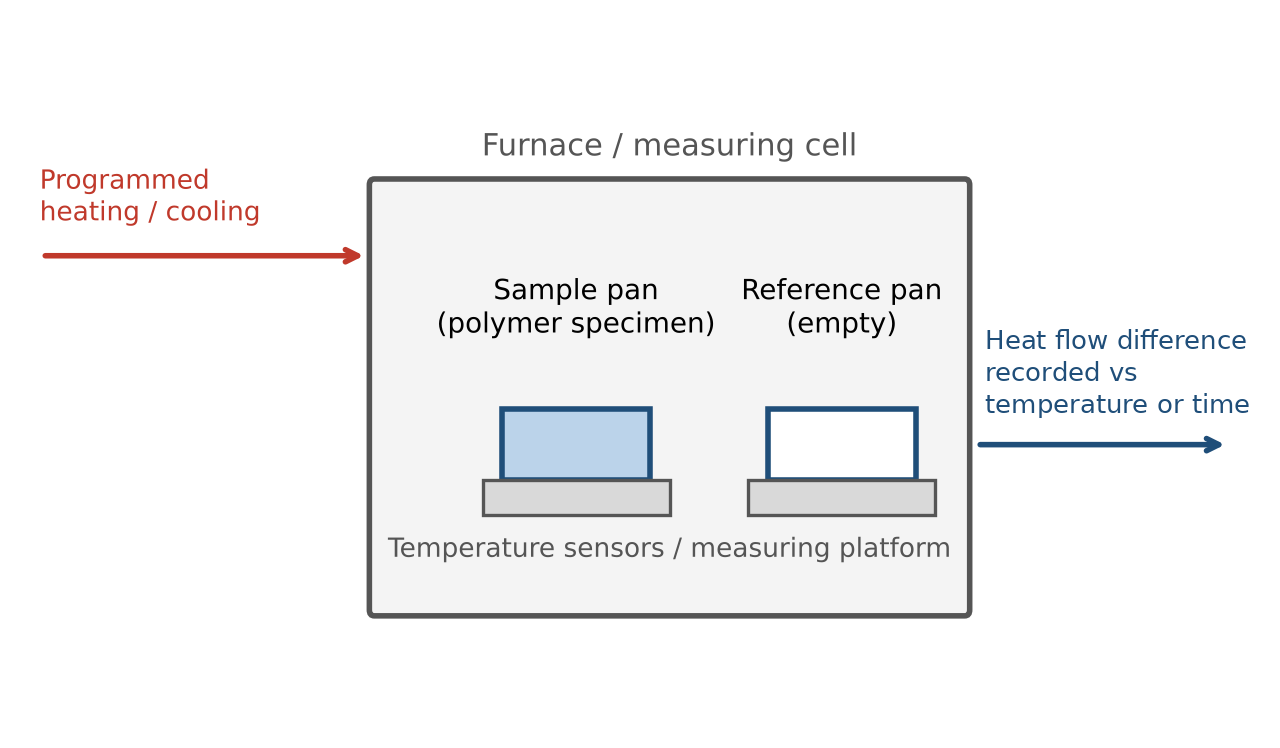
DSC does not produce a picture of this structure. Instead it records heat flow while the sample follows a controlled temperature program, so each thermal event shows up as a step or a peak in the signal. ASTM E793 describes DSC as a fast way to measure transitions in which heat is absorbed or released, such as melting and crystallization [5], which makes the technique well suited to screening and routine comparison.
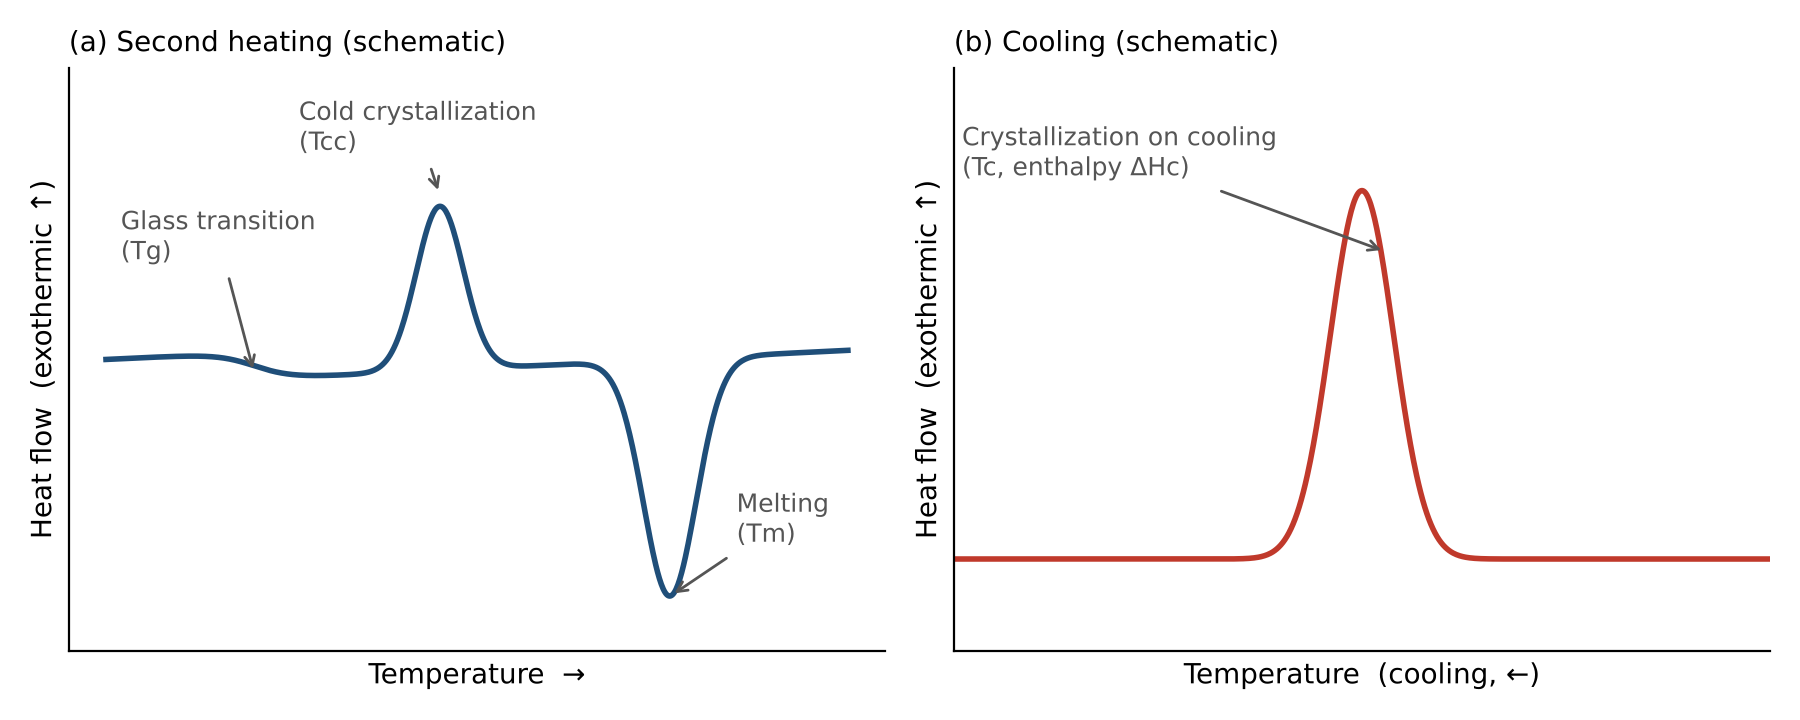
| Thermal event | What appears on the DSC curve | What it tells you |
|---|---|---|
| Glass transition (Tg) | A small step in the curve while heating | The disordered part of the polymer softens. The size of the step can reflect how much disordered material is present [6] |
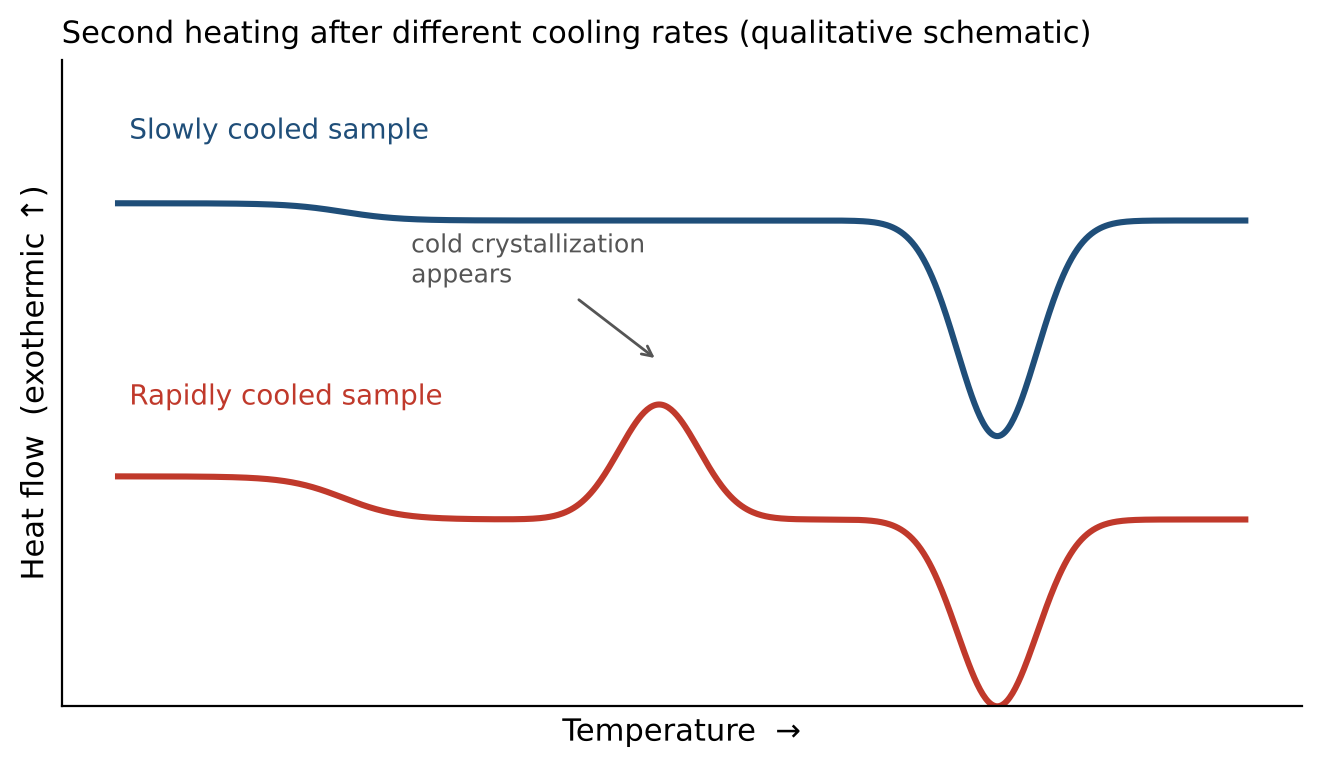
| Cold crystallization (Tcc) | A peak pointing in the heat releasing direction while heating, above Tg | Material that did not crystallize while cooling and crystallizes during the heating run instead [6] |
| Melting (Tm, ΔHm) | A heat absorbing peak while heating | The melting temperature and the amount of heat taken in as the crystal portion melts [2] |
| Crystallization on cooling (Tc, ΔHc) | A heat releasing peak while cooling from the molten state | The temperature at which crystals form and the amount of heat given off as the melt crystallizes [2] |
Table 1. Thermal events linked to polymer crystallization in a DSC test.
A note on which way peaks point
Whether heat releasing events point up or down on a plot depends on the software and on the convention being used. Always check the axis label before comparing curves from different instruments or laboratories. Figure 3 shows heat releasing events pointing up and states this on the axis.
Why Crystallization Behavior Matters
Crystallization behavior connects the way a plastic is processed to the structure it ends up with. A published application note shows how much the cooling rate can matter. In a NETZSCH application note on polyethylene terephthalate (PET), the same material was cooled at rates from 0.5 to 200 K/min and then reheated at 10 K/min. Samples cooled slowly showed no cold crystallization on reheating, while samples cooled at 20 K/min or faster showed a cold crystallization peak near 145 to 150 °C [6]. In short, the thermal history the sample picked up while cooling was plainly visible when it was heated a second time.
For the main user groups, this raises practical questions:
- Quality control: Does an incoming batch melt and crystallize the way the approved reference does? ASTM E793 points out that DSC is useful for quality control, acceptance against specifications and research [5].
- Process development: How much does the cooling rate used in processing shift the balance between crystalline and disordered material [6]?
- Material comparison: Do two grades, suppliers or formulations differ in their melting or crystallization temperature, or in the heat involved [2]?
- Research: How fast does the material crystallize at a given temperature, and what does that say about how crystals start and grow [3][7]?
DSC Measurement Modes for Crystallization Studies
Heating, cooling and reheating tests
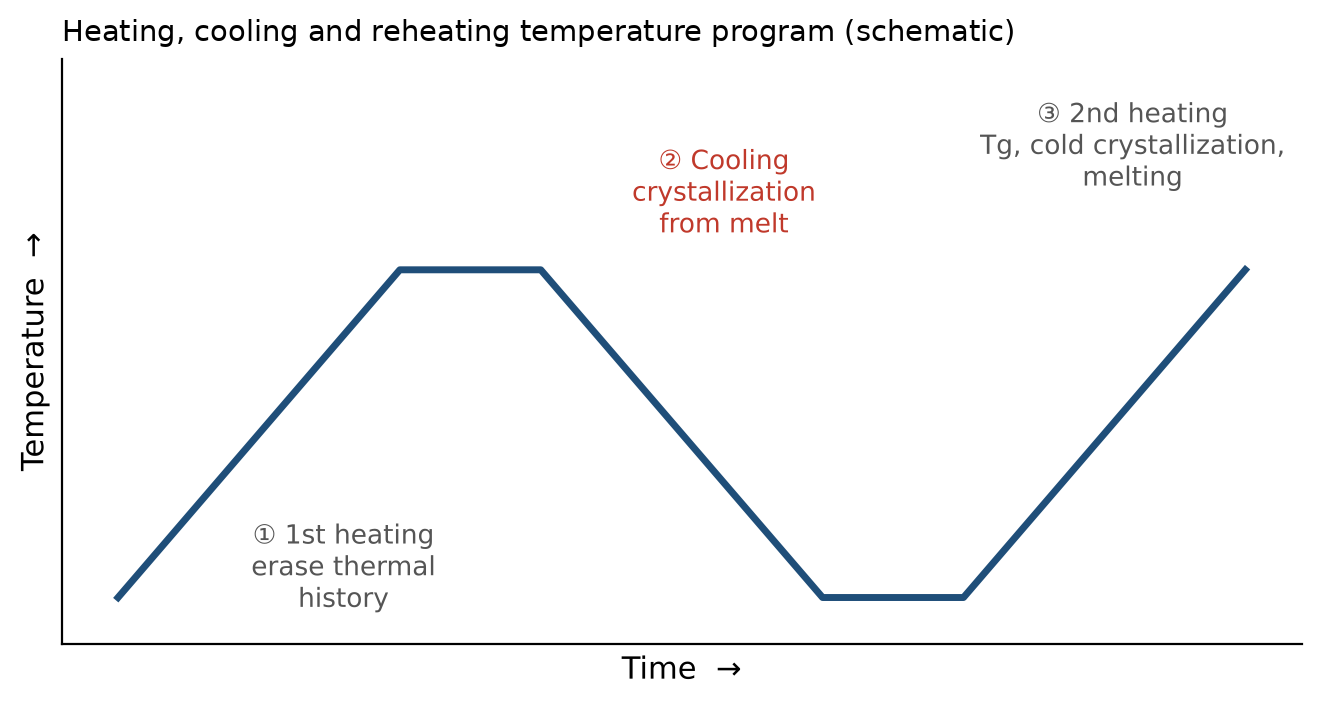
The most common routine test heats the sample, cools it and then heats it again. In the NETZSCH PET study, each sample was first heated to erase its earlier thermal history, then cooled at a set rate and reheated, and the second heating was the one analyzed [6]. This approach separates two things. The first heating reflects the material as it arrived, while the cooling and second heating show how the polymer itself behaves under controlled conditions.
From such a program an analyst can read the crystallization temperature and heat released on cooling, along with the glass transition, cold crystallization and melting on reheating [2][6].
Constant temperature and continuous cooling methods
ISO 11357-7 describes two DSC methods for studying how fast crystallization happens. One holds the temperature constant (isothermal) and the other cools continuously (nonisothermal). Both apply to partly crystalline polymers in the molten state. The standard also notes that the methods are not suitable if the molecular structure of the polymer changes during the test [3].
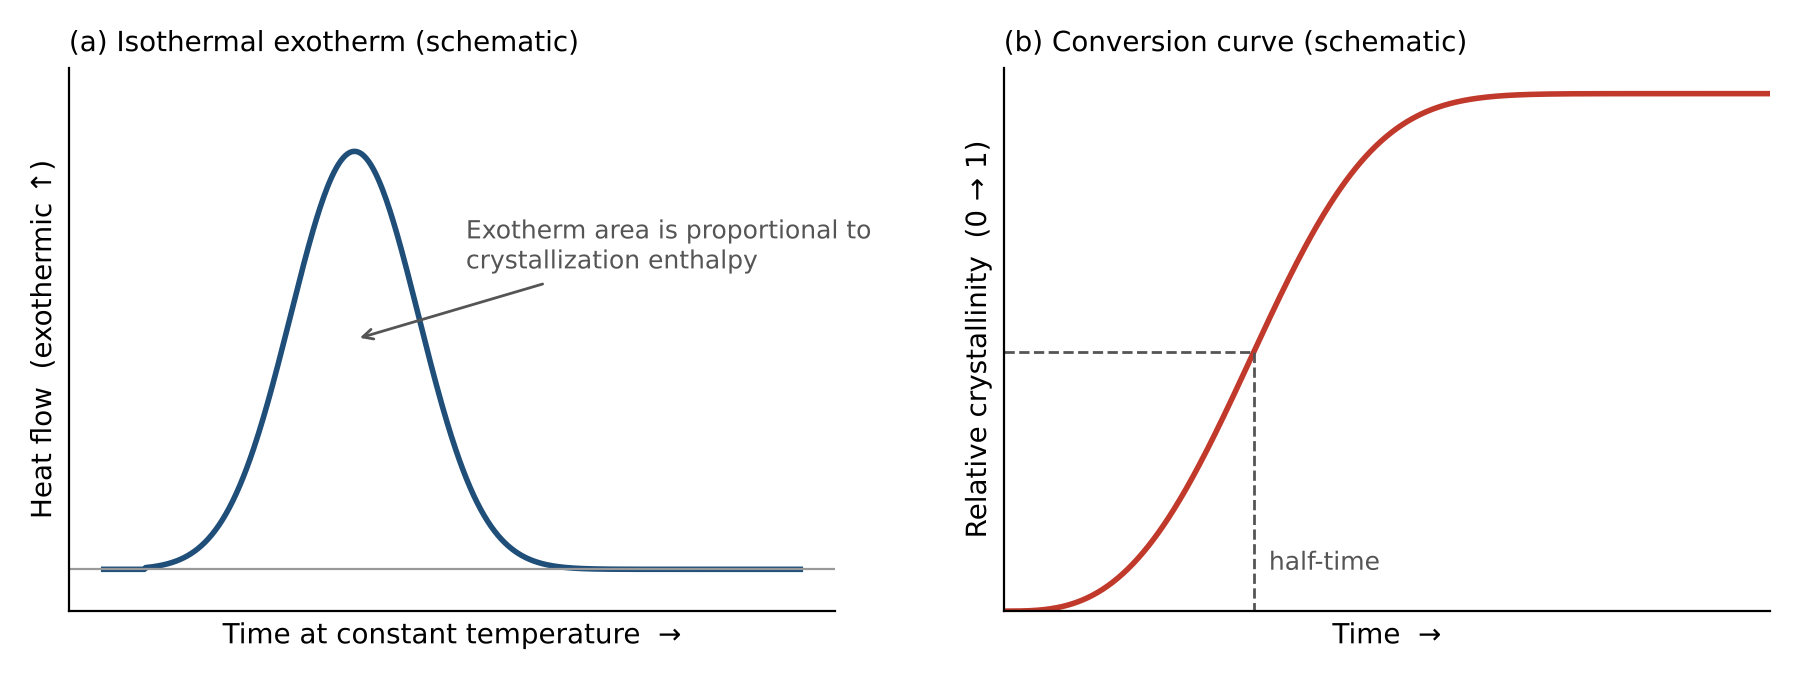
In a constant temperature test, the molten sample is brought to a chosen crystallization temperature and held there while the heat released is recorded over time. Adding up that heat shows how far crystallization has progressed (Figure 6). Constant temperature data are often fitted with the Avrami equation, a standard model of how crystallization advances with time [4]. A peer reviewed paper in Polymer Testing offers guidelines for avoiding common problems when fitting such DSC data with the Avrami equation [7].
The two approaches answer slightly different questions. Constant temperature runs describe crystallization at one fixed temperature, while continuous cooling runs are closer to many real processing conditions, where the temperature keeps falling as crystals form. The right choice depends on your objective (see 'How to Select the Appropriate Approach' below).
General Testing Workflow
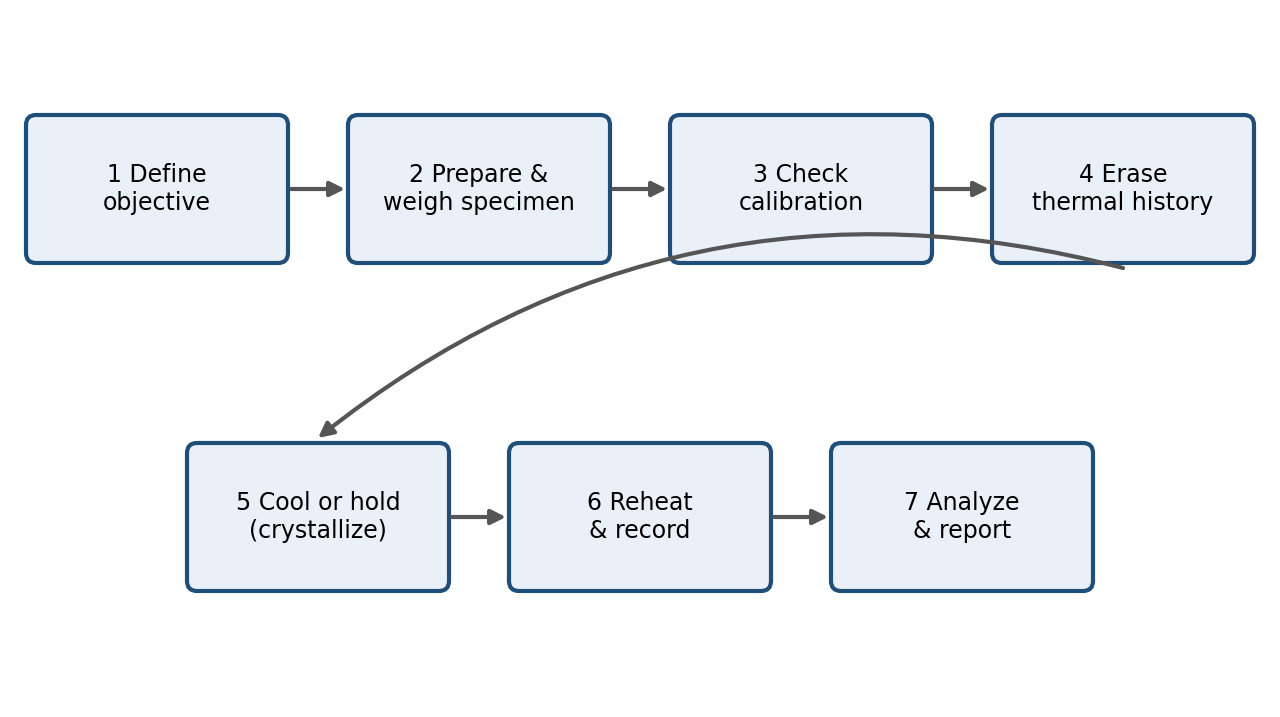
The sequence below is a general outline of a heating, cooling and reheating test. It does not replace the procedure in the standard or internal method you are following.
-
Define the objective. Decide whether you need a routine comparison (temperatures and heat amounts) or information on how fast crystallization happens, because this shapes the temperature program [2][3].
-
Prepare and weigh the specimen. ASTM E793 notes that the form and mass of the specimen and other test conditions can influence the result, so these should be controlled and recorded [5].
-
Check calibration. Temperature calibration and heat flow calibration are covered by ASTM E967 and ASTM E968 [8][9], and ISO 11357-1 lists calibration among its general principles [1].
-
Erase thermal history. Heat above the melting range so the first heating signal is not dominated by what the sample went through earlier in processing [6].
-
Cool under controlled conditions. Record the heat released as the sample crystallizes on cooling [2]. For work on how fast crystallization happens, hold at the chosen temperature instead [3].
-
Reheat and record. Observe the glass transition, any cold crystallization and melting [6].
-
Analyze and report. Work out peak temperatures and heat amounts using a consistent way of drawing the reference line under each peak, and report the conditions used [1].
Key Parameters and How to Interpret Them
| Parameter | Description | How to read it |
|---|---|---|
| Tm (melting temperature) | Temperature of the heat absorbing melting peak | Reported according to the method used. State how the temperature was read from the peak [2] |
| ΔHm (heat of melting, or enthalpy of melting) | Area under the melting peak | Linked to the crystalline fraction present at melting. See the crystallinity section below [2][10] |
| Tc (crystallization temperature) | Temperature of the heat releasing peak on cooling | Depends on cooling rate and thermal history. In the PET example, slowly cooled samples had already crystallized while cooling [6] |
| ΔHc (heat of crystallization, or enthalpy of crystallization) | Area under the cooling peak | Heat given off as the melt crystallizes [2] |
| Tcc and ΔHcc | Cold crystallization peak seen while heating | Shows material that crystallized only during reheating [6] |
| Tg and Δcp | Step in the heat flow trace | In the PET example, the step grew at faster cooling rates, which fits with more disordered material [6] |
| Crystallization kinetics (speed of crystallization) | How crystallization changes over time at a fixed temperature or during cooling | Evaluated under ISO 11357-7. Avrami analysis is often applied to constant temperature data [3][4][7] |
Table 2. Common DSC parameters in crystallization studies.
Estimating Degree of Crystallinity from DSC
DSC usually estimates crystallinity by comparing the measured heat of melting with the heat of melting of a hypothetical polymer that is 100 % crystalline. A TA Instruments application note on polymer heats of fusion explains that fully crystalline reference materials are rarely available, so these values are normally estimated indirectly, for example by extending trends from measured data using the Flory equation [10].
The simple form of the calculation is:
Crystallinity (%) = ΔHm / ΔHm° × 100
where ΔHm is the measured heat of melting and ΔHm° is the reference value for a fully crystalline polymer. The same note lists approximate reference values, shown here as examples of the size of the numbers involved:
| Polymer | Approximate ΔHm° (J/g) reported in [10] |
|---|---|
| Polyethylene | 293 |
| Polypropylene | 207 |
| Polyoxymethylene | 326 |
| Polyamide 6 | 230 |
| PET | 140 |
| PEEK | 130 |
| PVC | 176 |
| PTFE | 82 |
Table 3. Example reference heats of fusion for 100 % crystalline polymers, as listed in TA Instruments note TN048 [10]. Published values differ between sources, so state which value you used.
Three cautions apply when using this approach:
- The reference value is a choice. Because ΔHm° is estimated, the same curve can give different crystallinity values depending on where ΔHm° came from [10]. Always report the value you used.
- Recrystallization during heating can distort the result. Kong and Hay point out that the main difficulty in measuring crystallinity by DSC is that a sample can recrystallize while it melts, and they propose a procedure that accounts for this. They also note that the choice of liquid heat capacity (the heat needed to warm the molten polymer) can introduce a systematic error [11].
- Composition matters. The ISO 11357 series applies to polymers with or without fillers or reinforcements [1]. For filled or blended materials, the heat measured must be related to the amount of polymer actually present, otherwise crystallinity will be misreported.
Where the melting peak is preceded by a cold crystallization peak, the heat released during reheating should be taken into account when interpreting the crystallinity of the original sample [11].
Equilibrium Melting Temperature
The melting temperature you observe for a polymer depends on how it was crystallized. In a study published by the US National Bureau of Standards, Hoffman and Weeks showed for polychlorotrifluoroethylene that observed melting points change with the crystallization temperature, and they extended this relationship to estimate an equilibrium melting temperature. Their early polyethylene results also showed the observed melting point rising markedly as the crystallization temperature went up [12]. DSC is a practical way to collect such melting data, because the crystallization temperature can be set in a constant temperature step and the melting peak that follows can then be recorded.
This is an advanced research topic. Treat values obtained by extending the trend as estimates, and report the procedure used.
Worked Example: Cooling Rate Effects in PET
The NETZSCH application note gives a clear published example of how cooling rate shows up in a second heating run. The measurements used PET granulate in aluminum crucibles under nitrogen at 40 mL/min, with 10 K/min heating and a range of nominal cooling rates [6]. Selected results appear below. They apply only to that instrument, material and program and are not general PET properties. Because this is a single vendor note on one PET granulate, treat it as an illustration of the trend and not as a benchmark for other grades or instruments.
| Quantity (PET granulate, second heating) | Slow cooling (0.5 to 10 K/min) | Fast cooling (20 to 200 K/min) |
|---|---|---|
| Glass transition step, Δcp | About 0.12 J/(g·K) up to 10 K/min | About 0.19 at 20 K/min, then about 0.29 to 0.31 at 50 to 200 K/min |
| Cold crystallization | None observed (crystallized during cooling) | Peak near 145 to 150 °C; enthalpy about 11 J/g at 20 K/min and about 30 to 35 J/g at 50 to 200 K/min |
| Heat of melting | About 42 to 50 J/g | About 38 to 39 J/g |
Table 4. Selected results reported for PET granulate in NETZSCH Application Note 257 [6].
The same note observed that slowly cooled samples melted at a lower temperature (about 239 to 241 °C at 0.5 and 1 K/min) than the others (about 247 to 248 °C). The authors suggested two possible explanations: degradation during slow cooling, or two populations of crystal layer (lamella) thickness [6]. This is a useful reminder that unexpected peak shapes should be investigated and not simply reported.
Factors That Affect DSC Crystallization Results
| Factor | Why it matters |
|---|---|
| Thermal history | Earlier processing shows up in the first heating, which is why heating, cooling and reheating programs are used [6]. |
| Cooling and heating rate | In the PET example, cooling rate changed the Tg step size, the cold crystallization and the heat of melting [6]. |
| Specimen form and mass | ASTM E793 states that the form and mass of the specimen and other test conditions can affect the results [5]. |
| Calibration | Temperature and heat flow readings must both be calibrated for the reported temperatures and heat amounts to be meaningful [8][9]. |
| Recrystallization during melting | Can distort crystallinity values taken from the melting peak [11]. |
| Changes in molecular structure | ISO 11357-7 states that its methods for crystallization speed are unsuitable if the molecular structure of the polymer changes during testing [3]. |
| Choice of reference value | Using a different ΔHm° value gives a different crystallinity percentage [10]. |
| Conventional versus fast DSC | ISO 11357-3 covers conventional DSC. It does not apply to fast DSC, which is covered by ISO 23976 [2]. |
Table 5. Factors that can change DSC crystallization results.
Relevant Standards and Test Methods
Several standards are relevant. Pay attention to edition status: ISO 11357-3 and ISO 11357-7 have both been revised, and according to ISO the earlier editions (ISO 11357-3:2018 and ISO 11357-7:2015) are now withdrawn [2][3]. Check that your method refers to the current edition.
| Standard | Subject (from the published scope) | Relevance to crystallization work |
|---|---|---|
| ISO 11357-1:2023 | General principles of DSC for polymers: equipment, sampling, calibration, procedure and reporting [1] | Shared foundation for the other parts of the series |
| ISO 11357-3:2025 | Temperature and heat amount of melting and crystallization for crystalline or partly crystalline plastics [2] | Main method for Tm, Tc, ΔHm and ΔHc |
| ISO 11357-7:2022 | Speed of crystallization, at constant temperature and during continuous cooling, for molten partly crystalline polymers [3] | Studies of crystallization speed |
| ASTM D3418 (current edition D3418-21) | Transition temperatures and heat amounts of melting and crystallization of polymers by DSC [13] | ASTM method for polymers in granular form or cut from finished shapes |
| ASTM E794-24 | Melting and crystallization temperatures by thermal analysis. The scope concerns pure materials that stay chemically stable when heated [14] | Mainly relevant to clearly defined pure materials and less to typical commercial polymers |
| ASTM E793-24 | Heat amounts of melting and crystallization by DSC [5] | Heat amount measurement |
| ASTM E967-18 | Temperature calibration of DSC and DTA (differential thermal analysis) instruments [8] | Calibration |
| ASTM E968-25 | Heat flow calibration of DSC [9] | Calibration of the heat flow reading |
Table 6. Standards relevant to DSC crystallization studies. Descriptions paraphrase publicly available scope information. Consult the full standards for their requirements.
Industry Applications
Crystallization studies by DSC matter wherever semicrystalline polymers are processed or specified. Because the ISO 11357 series covers plastics that soften when heated, plastics that set permanently and rubbery materials [1], DSC is not limited to a single product category. Typical uses include:
- Plastics manufacturing and blending: comparing grades, checking batches against a reference and judging the effect of cooling conditions [2][5][6].
- Research and development: studying how fast crystallization happens and comparing formulations [3][7].
- Testing laboratories: routine measurement of melting and crystallization temperatures and heat amounts according to a defined standard [2][13].
The Testshine product page for the TS-DSC-100A names polymer and plastics, chemical, food and medical as fields where the instrument is used [15]. The crystallization discussion in this article concerns polymers and plastics only.
Quality Control and Product Development
DSC data support decisions at several points in a product's life:
- Incoming inspection and specification acceptance: compare melting and crystallization temperatures and heat amounts with an approved reference [5].
- Process control: because cooling rate changed the observed thermal behavior of PET in published data, comparing second heating curves can show whether a process produced a different balance of disordered and crystalline material [6].
- Material comparison: compare Tc, Tm and heat amounts for different grades under identical conditions [2].
- Development: constant temperature and continuous cooling experiments help describe how fast a formulation crystallizes [3].
DSC results describe thermal behavior and are not a direct measure of mechanical properties. Any link between crystallinity values and part performance must be established by testing the material and application in question.
Common Testing Challenges
- Unclear thermal history. Comparing first heating data from samples processed differently can mislead. A controlled cooling step removes this uncertainty [6].
- Overlapping events. Cold crystallization and melting can overlap, and a sample can recrystallize while melting, which complicates heat amounts and crystallinity values [11].
- Choice of reference value. Reference ΔHm° values are estimates and vary by source [10].
- Fitting crystallization speed models. The Avrami equation is widely applied to constant temperature data, but a peer reviewed paper devoted to avoiding common problems in these fits shows that the difficulty is real [7].
- Calibration drift. Without calibration of temperature and heat flow, results may not be comparable between instruments or over time [8][9].
- Unexpected peaks. Shoulders or double melting peaks need investigation. The PET note offers more than one possible explanation for its shoulder [6].
How to Select the Appropriate Approach
| Question | Approach to consider | Reference |
|---|---|---|
| Does a batch match the approved reference? | Heating, cooling and reheating run with fixed rates; compare Tm, Tc and heat amounts | ISO 11357-3 [2]; ASTM D3418 [13] |
| How does cooling rate change structure? | Repeat the cooling step at several rates, then reheat under identical conditions | Example in [6] |
| How fast does the polymer crystallize at a given temperature? | Constant temperature (isothermal) crystallization | ISO 11357-7 [3]; fitting guidance in [7] |
| How does crystallization behave during continuous cooling? | Continuous cooling (nonisothermal) crystallization | ISO 11357-7 [3] |
| What is the degree of crystallinity? | Heat of melting with a stated reference value, allowing for recrystallization | [10][11] |
Table 7. Matching the question to a DSC approach.
Instrument considerations
For crystallization work, the instrument features that matter include the temperature range, the ability to program controlled heating and cooling, the cooling method available, control over the gas around the sample and calibration support. Controlled cooling is especially important because crystallization is observed on cooling or at a held temperature after cooling [2][3]. Calibration with reference materials is addressed in ASTM E967 and E968 [8][9].
The Testshine TS-DSC-100A in Context
This section is specific to Testshine and is based only on the product page at testshine.cn [15]. It is separate from the general technical discussion above.
The Testshine Differential Scanning Calorimeter, model TS-DSC-100A, is built with an imported E pair sensor and a signal circuit with shielding protection. According to the product page, it supports these test functions: glass transition temperature, phase transition temperature, melting point, enthalpy value, curing temperature, product stability and oxidation induction period [15]. The listed specifications include:
| Parameter | Value listed on the Testshine product page [15] |
|---|---|
| Temperature range | Room temperature to 600 °C |
| Temperature resolution | 0.01 °C |
| Temperature fluctuation / repeatability | ±0.1 °C / ±0.1 °C |
| Heating rate | 0.1 to 100 °C/min |
| Temperature control | Fully automatic heating, constant temperature hold and cooling |
| Incubation time | Program setting, ≤ 24 h |
| DSC range | 0 to ±600 mW |
| DSC resolution / sensitivity | 0.01 µW / 0.01 mW |
| Gas flow / gas pressure | 0 to 200 mL/min / ≤ 0.5 MPa |
| Atmosphere control | Automatic N₂/O₂ switching |
| Cooling | Air cooling standard; optional semiconductor cooling (−40 to 550 °C) or liquid nitrogen cooling (−150 to 550 °C) |
| Display and data | 7 inch LCD touch screen; USB data interface |
| Calibration materials | Indium and tin reference materials for user temperature correction |
Table 8. Specifications as listed on the Testshine TS-DSC-100A product page [15].
For crystallization experiments, the most relevant features on this list are the programmable heating rate, the automatic constant temperature hold and cooling, the cooling options, the gas switching, and the listed melting point and enthalpy functions. Users who need specific cooling rate control, compliance with a named standard, or evaluation functions designed for crystallization should confirm these directly with Testshine, because the product page does not state them.
Conclusion
DSC is a practical way to understand how semicrystalline polymers crystallize and melt. A well designed heating, cooling and reheating program reveals the glass transition, cold crystallization, melting and crystallization on cooling, while constant temperature and continuous cooling experiments address crystallization speed under ISO 11357-7 [1][2][3]. Published data on PET show how strongly cooling rate can change the thermal behavior seen in the second heating [6].
Results are only as reliable as the method behind them. Control the thermal history, record the specimen and program details, calibrate both temperature and heat flow, state the reference value used for crystallinity, and watch for recrystallization during melting [5][8][9][10][11]. Always use the current editions of the standards.
Relevant Testshine Product
Explore the Testshine TS-DSC-100A Differential Scanning Calorimeter for Polymer Thermal Analysis
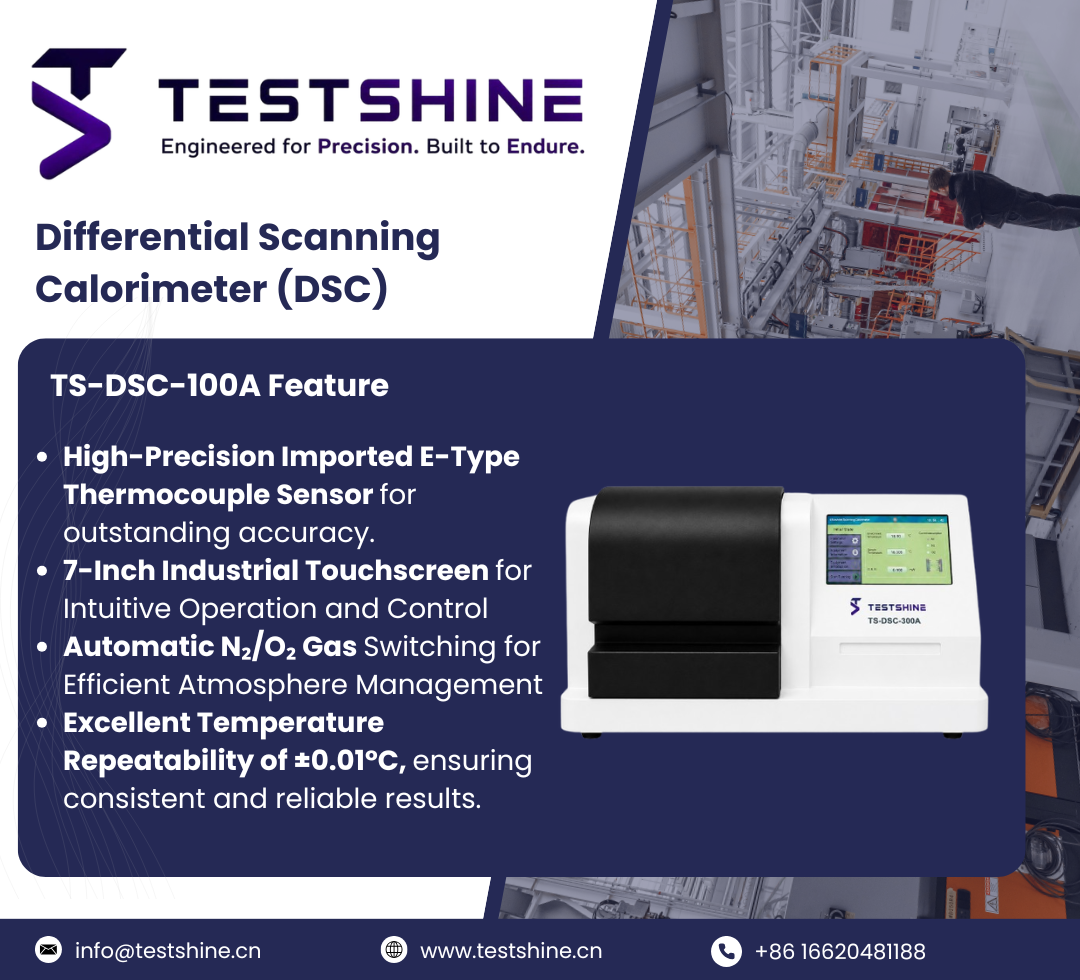
Studying polymer crystallization by DSC depends on a controlled temperature program and a calibrated instrument, as discussed in this article. The Testshine product page lists the TS-DSC-100A Differential Scanning Calorimeter with automatic heating, hold and cooling control and a range from room temperature to 600 °C [15].
Why it fits polymer crystallization work:
- Programmed heating, hold and cooling. Heating, constant temperature hold and cooling are fully automatic, with a heating rate of 0.1 to 100 °C/min, which suits the heating, cooling and constant temperature steps described above.
- Cooling options. Air cooling comes as standard, with optional semiconductor cooling (−40 to 550 °C) or liquid nitrogen cooling (−150 to 550 °C), which is valuable because crystallization is recorded while cooling.
- Melting and enthalpy functions. The page lists glass transition temperature, melting point and enthalpy value among its test functions, which are the quantities taken from a crystallization curve.
- Atmosphere control. Automatic N₂/O₂ switching, with a gas flow of 0 to 200 mL/min.
- Calibration. Indium and tin reference materials are listed for user temperature correction, consistent with the calibration practice discussed above.
The page lists polymer and plastics, chemical, food and medical applications and states that the instrument serves universities, enterprises, and third party measurement and quality inspection units. If your crystallization study needs a specific cooling program, talk to the Testshine team to confirm that the instrument suits your test method.
References
-
ISO, "ISO 11357-1:2023 Plastics: Differential scanning calorimetry (DSC): Part 1: General principles," Edition 4, International Organization for Standardization, 2023. https://www.iso.org/standard/83904.html
-
ISO, "ISO 11357-3:2025 Plastics: Differential scanning calorimetry (DSC): Part 3: Determination of temperature and enthalpy of melting and crystallization," Edition 4, International Organization for Standardization, 2025 (replaces ISO 11357-3:2018). https://www.iso.org/standard/88106.html
-
ISO, "ISO 11357-7:2022 Plastics: Differential scanning calorimetry (DSC): Part 7: Determination of crystallization kinetics," Edition 3, International Organization for Standardization, 2022 (replaces ISO 11357-7:2015). https://www.iso.org/standard/81832.html
-
M. Avrami, "Kinetics of Phase Change. II Transformation Time Relations for Random Distribution of Nuclei," The Journal of Chemical Physics, vol. 8, no. 2, pp. 212 to 224, 1940. https://doi.org/10.1063/1.1750631
-
ASTM International, "ASTM E793-24 Standard Test Method for Enthalpies of Fusion and Crystallization by Differential Scanning Calorimetry," 2024. https://store.astm.org/e0793-24.html
-
A. T. Lorenzo, M. L. Arnal, J. Albuerne and A. J. Müller, "DSC isothermal polymer crystallization kinetics measurements and the use of the Avrami equation to fit the data: Guidelines to avoid common problems," Polymer Testing, vol. 26, no. 2, pp. 222 to 231, 2007. https://doi.org/10.1016/j.polymertesting.2006.10.005
-
ASTM International, "ASTM E967-18 Standard Test Method for Temperature Calibration of Differential Scanning Calorimeters and Differential Thermal Analyzers," 2018. https://store.astm.org/e0967-18.html
-
ASTM International, "ASTM E968-25 Standard Practice for Heat Flow Calibration of Differential Scanning Calorimeters," 2025. https://store.astm.org/e0968-25.html
-
R. L. Blaine, "Polymer Heats of Fusion," Thermal Applications Note TN048, TA Instruments. https://www.tainstruments.com/pdf/literature/TN048.pdf
-
Y. Kong and J. N. Hay, "The measurement of the crystallinity of polymers by DSC," Polymer, vol. 43, no. 14, pp. 3873 to 3878, 2002. https://doi.org/10.1016/S0032-3861(02)00235-5
-
J. D. Hoffman and J. J. Weeks, "Melting Process and the Equilibrium Melting Temperature of Polychlorotrifluoroethylene," Journal of Research of the National Bureau of Standards, Section A, vol. 66A, no. 1, 1962. https://nvlpubs.nist.gov/nistpubs/jres/066/1/V66.N01.A03.pdf
-
ASTM International, "ASTM D3418-21 Standard Test Method for Transition Temperatures and Enthalpies of Fusion and Crystallization of Polymers by Differential Scanning Calorimetry," 2021. https://store.astm.org/d3418-21.html
-
ASTM International, "ASTM E794-24 Standard Test Method for Melting and Crystallization Temperatures by Thermal Analysis," 2024. https://store.astm.org/e0794-24.html
-
Testshine, "Differential Scanning Calorimeter TS-DSC-100A," product page, testshine.cn (accessed 14 October 2026). https://testshine.cn/products/analytical-instruments/ts-100a/