
Using TGA to Analyze Polymer Decomposition and Material Composition
Using TGA to Analyze Polymer Decomposition and Material Composition
A Technical Guide to Thermal Analysis for the Polymer, Rubber, and Plastics Industry
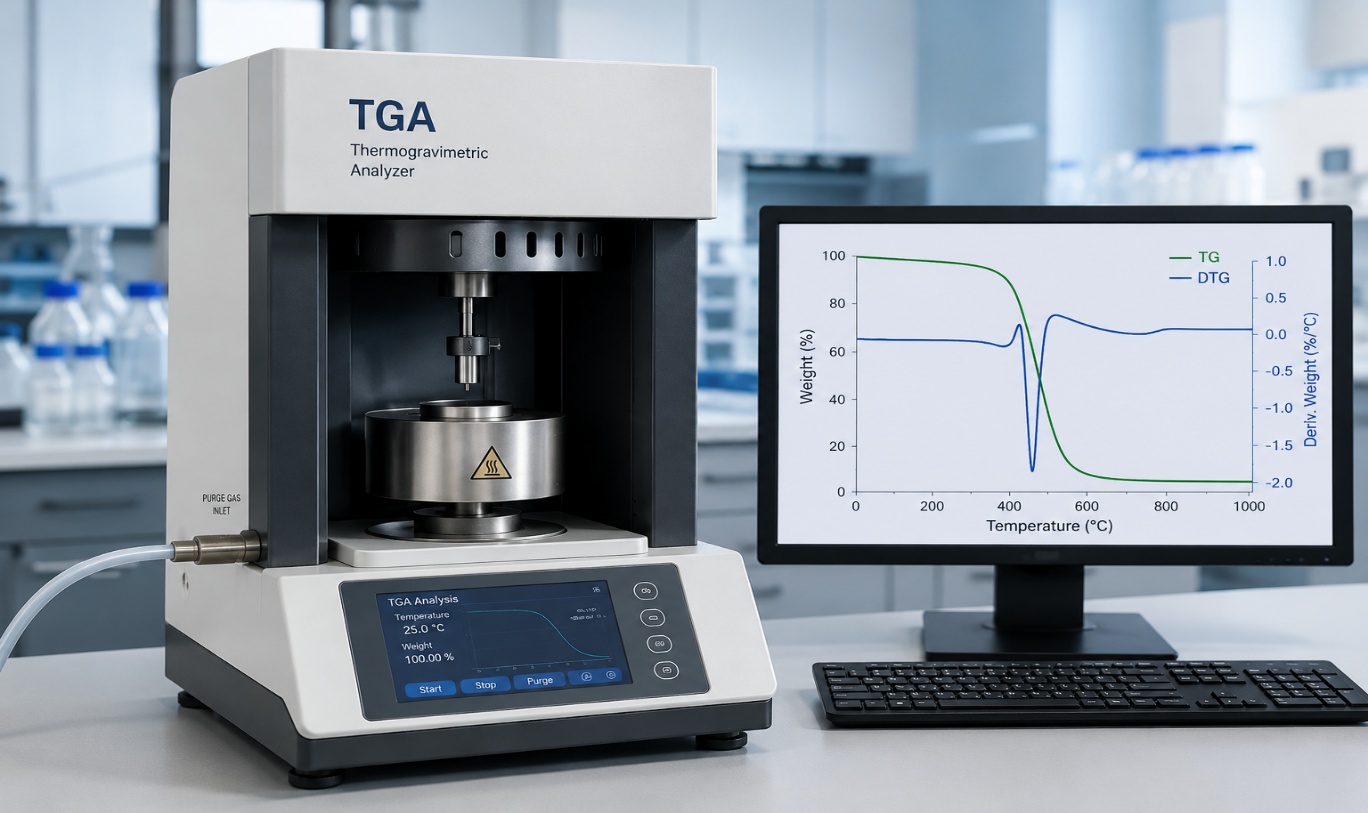
Thermogravimetric analysis, commonly called TGA, is one of the most widely used thermal analysis methods in the polymer, rubber, and plastics industries. It works by tracking how much a material's mass changes as it is heated under controlled conditions. This gives engineers, quality control teams, and research and development chemists a fast, quantitative way to check thermal stability, confirm formulas, spot contamination, and understand how a polymer breaks down at high temperature. This article explains how TGA works, what it reveals about polymer breakdown and composition, the standards that govern its use, and how it is applied in material development, quality control, and failure analysis.
1. What Is Thermogravimetric Analysis?
Thermogravimetric analysis measures the mass of a sample continuously while it is heated, or held at a constant temperature, in a controlled atmosphere. As the temperature rises, physical and chemical processes occur: moisture evaporates, solvents or plasticizers are lost, polymer chains break down, oxidation happens, and carbon rich residue forms. Each of these events causes the sample to lose mass within a specific temperature range. Because each event happens in its own characteristic temperature window and produces a measurable mass change, the resulting data can show both the thermal stability of a material and what it is made of.
A TGA instrument has a few core parts:
-
A precision balance that can measure mass changes as small as micrograms and records the sample weight continuously throughout the test.
-
A furnace that heats the sample chamber following a set temperature plan, typically from room temperature up to somewhere between 600 and 1000 degrees Celsius, depending on the material and the goal of the test.
-
A sample pan or crucible, usually made of platinum, alumina, or ceramic, chosen because it stays chemically stable at high temperature.
-
A purge gas supply, most commonly nitrogen for an atmosphere without oxygen, or air and oxygen for an atmosphere that allows oxidation. This gas flows through the furnace to control the reaction environment and carry away gases released during breakdown.
-
A data system that plots mass, or mass percentage, against temperature and time, creating the thermogravimetric curve.
The choice of atmosphere strongly affects how a TGA test should be read. Under nitrogen, a polymer breaks down mainly through pyrolysis, meaning thermal breakdown without oxygen present. Under air or oxygen, the same polymer usually shows extra stages of mass loss caused by oxidation, including the burning of carbon rich residue that would otherwise stay stable in an atmosphere without oxygen. Many composition test methods deliberately change the purge gas partway through a single run, starting under nitrogen and later switching to air, to separate polymer breakdown from filler burning within one continuous test.
2. Reading a TGA Curve: Mass Loss, the DTG Curve, and Key Values
The main output of a TGA test is a plot of sample mass, shown as a percentage of the starting mass, against temperature. This is often called the TG curve. A second, equally useful curve is calculated from it: the derivative curve, or DTG curve, which plots the rate of mass loss against temperature. Where the TG curve shows a gradual step down, the DTG curve shows a clear peak. This makes it much easier to find the exact temperature at which a breakdown event is happening fastest, and to tell apart overlapping breakdown steps that might be hard to separate on the TG curve alone.
Several values are routinely pulled from these curves for reporting and comparison:
-
Onset temperature (Tonset): the temperature at which a specific mass loss event begins. It is typically found where two lines drawn along the TG curve, one before and one during the weight loss step, cross each other. This value is often used as a sign of a material's thermal stability limit.
-
Peak breakdown temperature (Tmax or Tp): the temperature at which the rate of mass loss is greatest, found at the peak of the matching DTG curve.
-
T5% and T10%: the temperatures at which 5 percent or 10 percent of the sample's mass has been lost. These are common reference points for comparing thermal stability between formulas or batches.
-
Residual mass (char yield or ash content): the mass percentage left at the end of the test. This reflects inorganic fillers, reinforcing fibers, pigments, or carbon rich char that does not turn to gas within the tested temperature range.
-
Number and size of mass loss steps: each distinct step in the TG curve usually matches a separate physical or chemical event, such as moisture loss, plasticizer loss, polymer breakdown, or filler burning. The percentage of mass lost in each step is used to calculate that component's share of the material.
3. How Polymers Break Down Under Heat
Understanding a TGA curve requires some background on how polymers actually break down when heated. Polymer breakdown is a chemical process driven by the breaking of bonds in the polymer backbone or side groups. It generally happens through one or more of the following:
Random chain breaking happens when bonds break at random points along the polymer backbone, producing a wide range of shorter chain fragments. This is typical of polyolefins such as polyethylene (PE) and polypropylene (PP), which tend to break down over a fairly wide temperature range as chains split into smaller and smaller hydrocarbon fragments and gases.
End chain breaking, also called unzipping, happens when the polymer breaks down step by step from the chain end, releasing individual monomer units. Poly(methyl methacrylate), or PMMA, is a well known example of a polymer that breaks down largely back into its original monomer under heat.
Side group loss involves the loss of an attached group from the polymer backbone without immediately breaking the main chain. The most industrially important example is polyvinyl chloride, or PVC, which loses hydrogen chloride gas in a step by step process at fairly low temperatures, well before the remaining backbone structure itself breaks down at higher temperature. This is why PVC typically shows two distinct mass loss stages in its TGA curve instead of one.
Cross linking and char formation happen in some polymers, especially those with ring shaped structures, where heat encourages new bonds to form between chains instead of simple fragmentation. This tends to produce a stable, carbon rich char that resists further breakdown, adding to a higher residual mass at the end of a TGA scan.
Oxidative breakdown becomes relevant whenever oxygen is present, either because the test atmosphere includes air or oxygen, or because the polymer is being tested for real world conditions. Oxidative pathways generally happen through chain reactions involving reactive oxygen fragments, and tend to lower the onset temperature of breakdown and speed up mass loss compared to an atmosphere without oxygen. This is one reason TGA tests are often run under both types of atmosphere for comparison.
In practice, most commercial polymers and compounded materials show a mix of these mechanisms, along with contributions from additives, stabilizers, plasticizers, and fillers, each of which turns to gas or breaks down in its own characteristic temperature window.
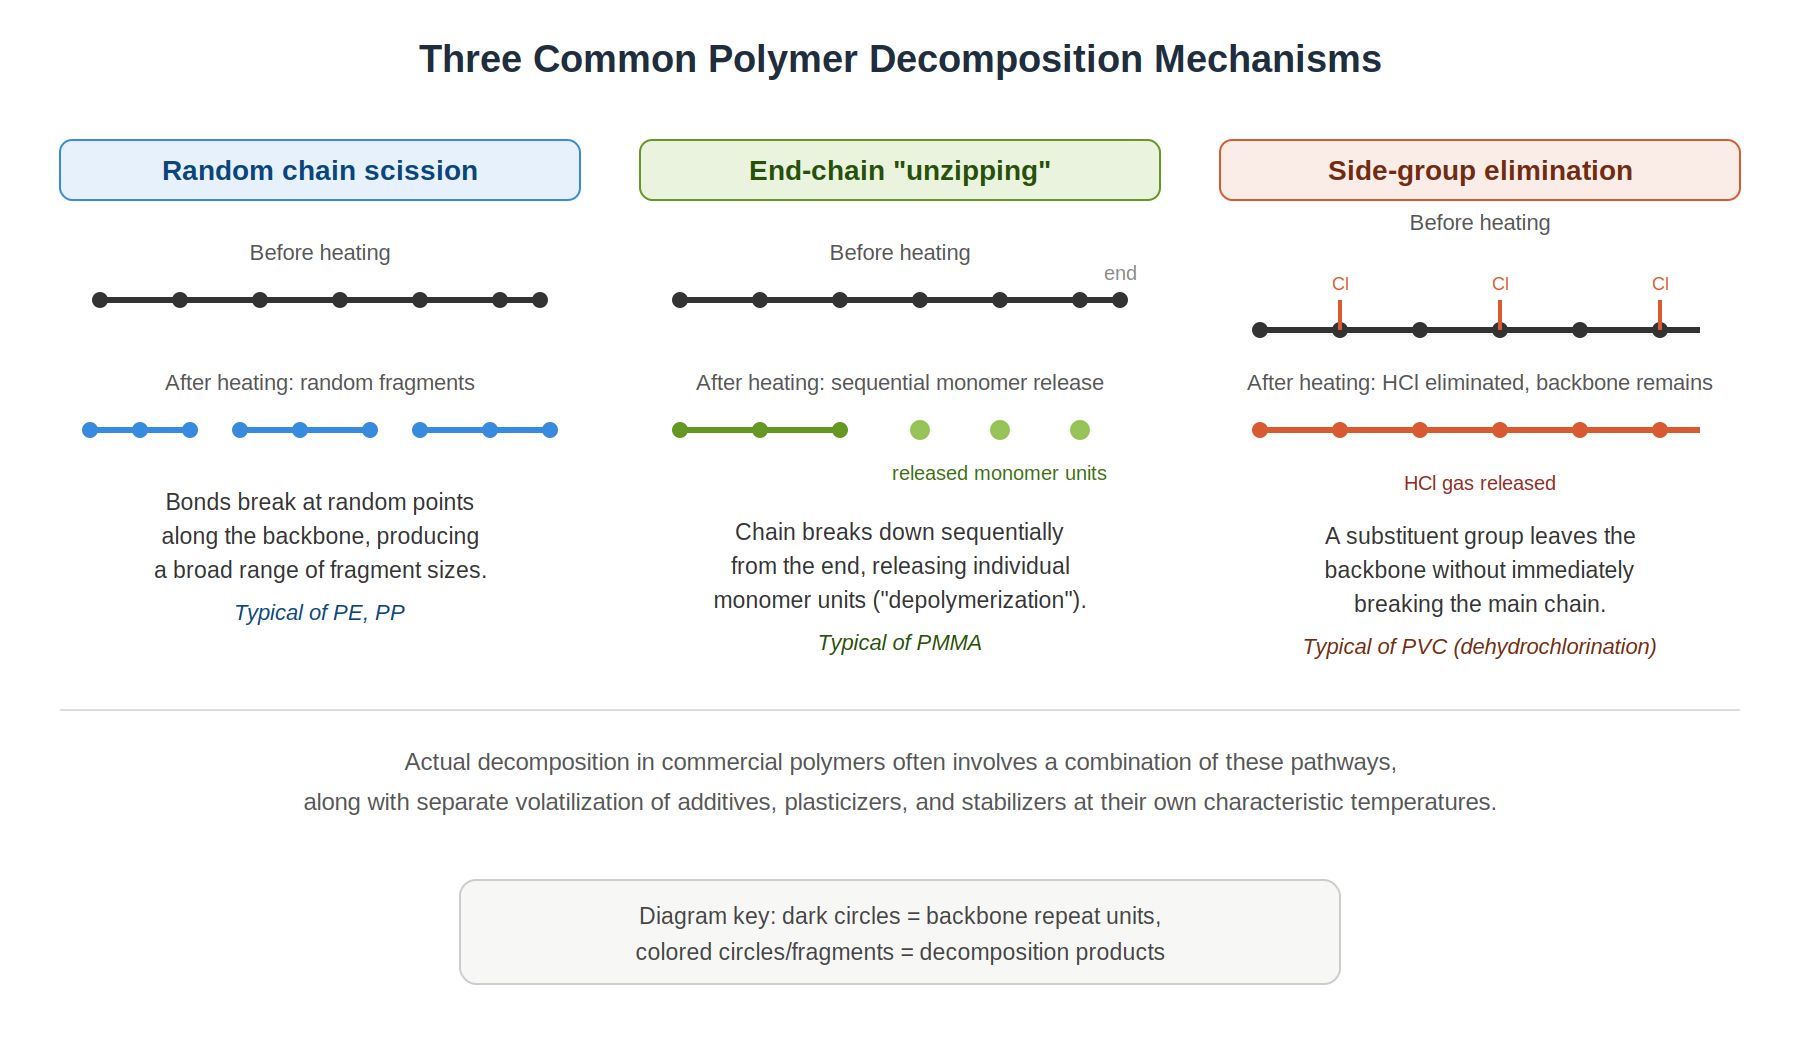
Figure 2. The three main polymer breakdown pathways: random chain breaking, end chain unzipping, and side group loss.
4. Breakdown Behavior of Common Polymer Families
Exact breakdown temperatures depend on molecular weight, crystal structure, additives, and heating rate. Even so, TGA testing across the industry has established broadly typical breakdown patterns for major polymer classes. These general patterns are useful for identifying materials and for sanity checking test results, though actual values from any single TGA run should always be read based on the specific test conditions used.
| Polymer | Typical Breakdown Behavior in TGA |
|---|---|
| Polyethylene (PE) and Polypropylene (PP) | Break down in a single, fairly sharp mass loss step through random chain breaking, typically leaving very little or no residue in an atmosphere without oxygen. This matches a backbone made entirely of carbon and hydrogen. |
| Polyvinyl chloride (PVC) | Shows two distinct breakdown stages: an earlier stage where hydrogen chloride gas is lost, followed by a higher temperature stage where the remaining structure breaks down further. |
| Polyethylene terephthalate (PET) | Breaks down in a single main stage through breaking of ester links, generally leaving minimal residue when unfilled. |
| Polytetrafluoroethylene (PTFE) | One of the most thermally stable common polymers, breaking down at noticeably higher temperatures than polyolefins. This reflects the strength of the carbon fluorine bond. |
| Polyamides (nylons, PA6/PA66) | Typically break down in a single stage at temperatures above most polyolefins, with breakdown products shaped by the amide links in the backbone. |
| Elastomers and rubber compounds | Show several sequential mass loss stages matching moisture and volatiles, oil or plasticizer loss, polymer (rubber) breakdown, and, once the atmosphere is later switched to one with oxygen, burning of carbon black, leaving inorganic ash as the final residue. |
| Filled and reinforced composites | Show an initial polymer matrix breakdown step, or steps, followed by a stable, higher residual mass matching material that does not burn, such as glass fiber, mineral filler, or metal content. |
Because different polymer families break down over distinct, often non overlapping temperature windows, TGA is a practical tool not just for measuring thermal stability but for supporting material identification and confirming that an unknown or incoming material matches its specification, especially when combined with related techniques discussed later in this article.
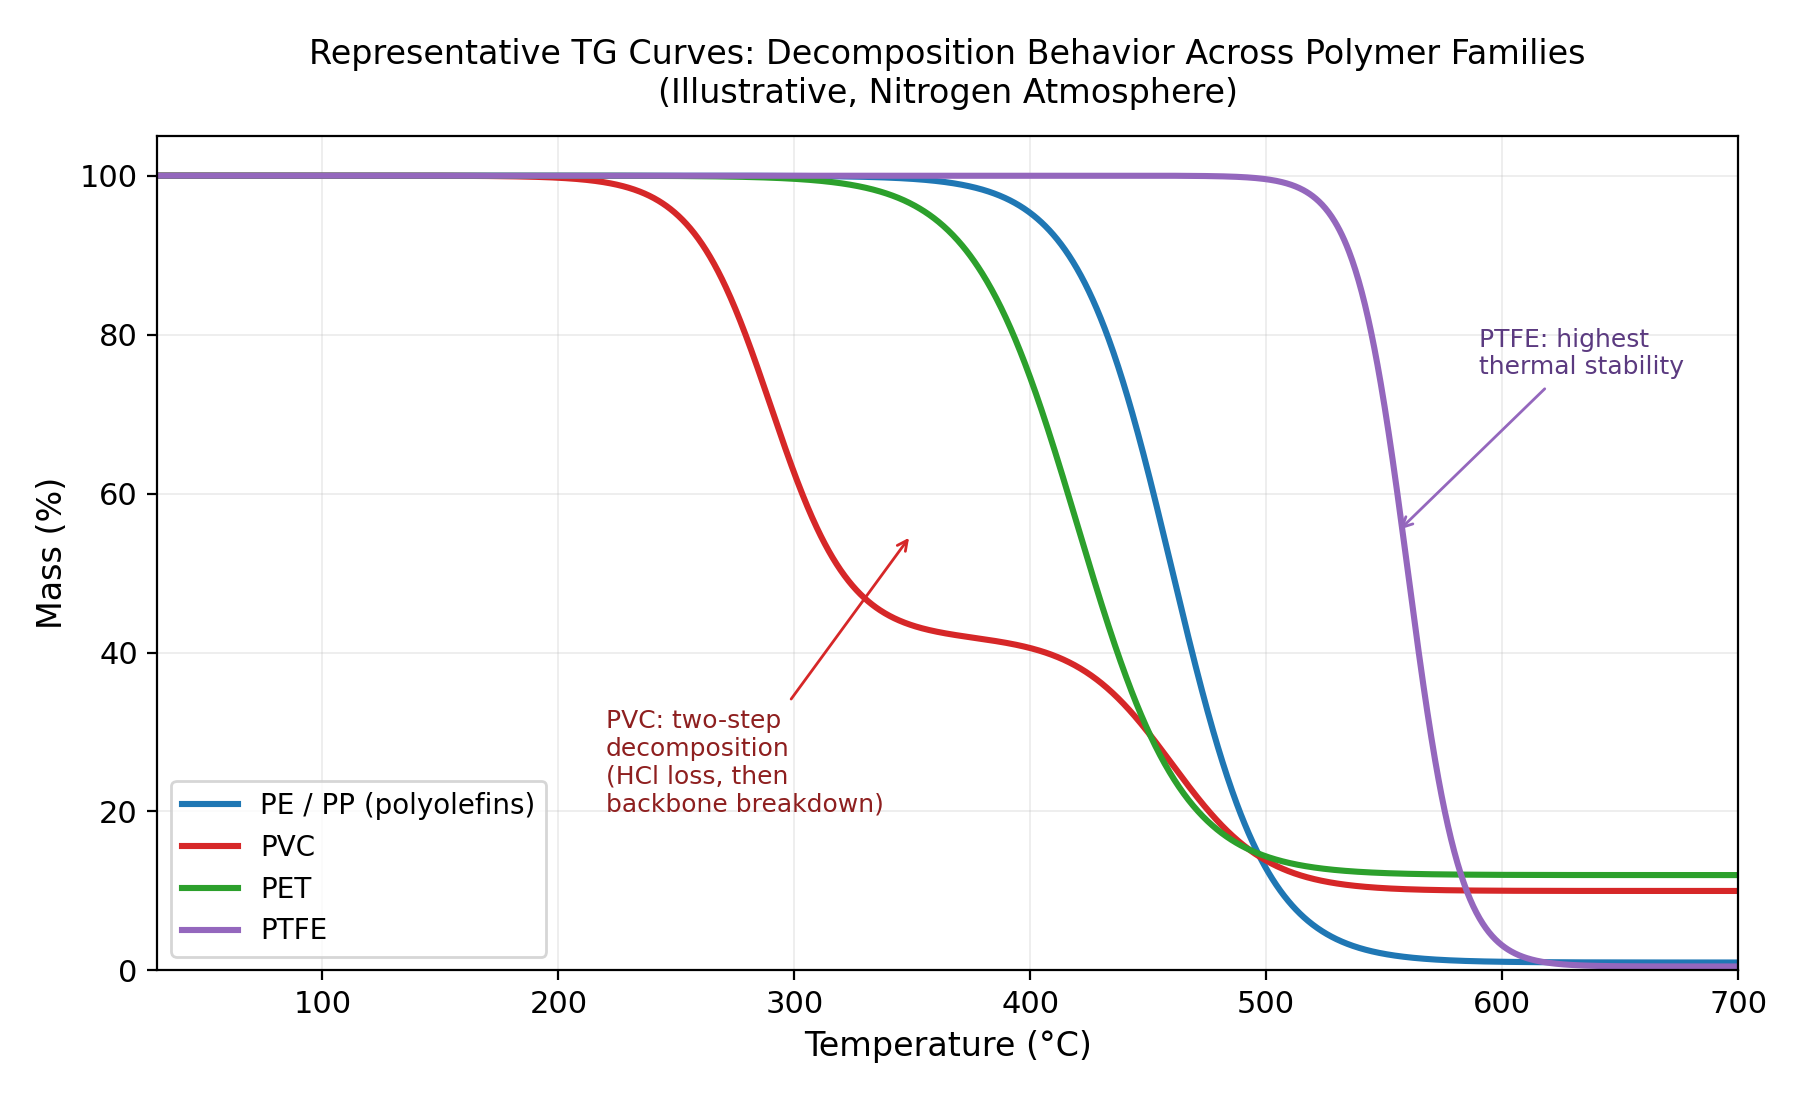
Figure 3. A comparison of TG curves across polymer families, showing PVC's two step breakdown and PTFE's much higher thermal stability compared with the polyolefins.
5. TGA for Material Composition Analysis
Beyond thermal stability, one of TGA's most valuable industrial uses is composition analysis: figuring out how much of a sample is made up of moisture, volatile organics, polymer, filler, and inorganic residue, all from a single test run. This approach is formalized in ASTM E1131, the standard test method for compositional analysis by thermogravimetry. It uses a staged heating program combined with a deliberate atmosphere switch to separate a sample into distinct composition categories:
-
Moisture and low boiling volatiles are lost at fairly low temperatures, typically up to around 100 to 150 degrees Celsius, reflecting absorbed water or leftover processing solvents.
-
Medium volatility components, such as plasticizers or certain additives, are lost at moderate temperatures as the program continues.
-
Polymer or organic content breaks down at higher temperatures under the atmosphere without oxygen, representing the bulk resin or rubber matrix.
-
Combustible filler, such as carbon black, is burned once the purge gas is switched from nitrogen to air or oxygen at a set point in the program, causing another mass loss step that would not happen in an atmosphere without oxygen.
-
Inorganic filler or ash remains as the final residual mass once all combustible material has been used up, representing mineral fillers, pigments, glass content, or other additives that do not burn.
This same general staged approach is behind ASTM D6370, the standard test method for rubber compositional analysis by thermogravimetry, which is written specifically for cured rubber compounds. D6370 is used to work out the proportions of organics (oil and polymer), carbon black, and ash in a rubber formula. It is a standard quality control and material screening tool in the tire, seal, hose, and molded rubber goods industries. The standard notes that it is not suitable, without correction, for compounds containing fillers that themselves break down within the test's working temperature range, such as calcium carbonate or aluminum hydroxide, since these could be mistaken for organic content if not accounted for separately.
ISO 11358, Parts 1 to 3, covering thermogravimetry of plastics, provides the matching international framework. It covers general principles and procedures for applying TGA to plastics, including guidance on studying the rate of breakdown.
Because TGA reports each compositional fraction as a percentage of total sample mass, the technique offers a fast, quantitative alternative to older manual methods such as ashing in a muffle furnace. It produces results for several compositional fractions within a single, automated run rather than a series of separate tests.
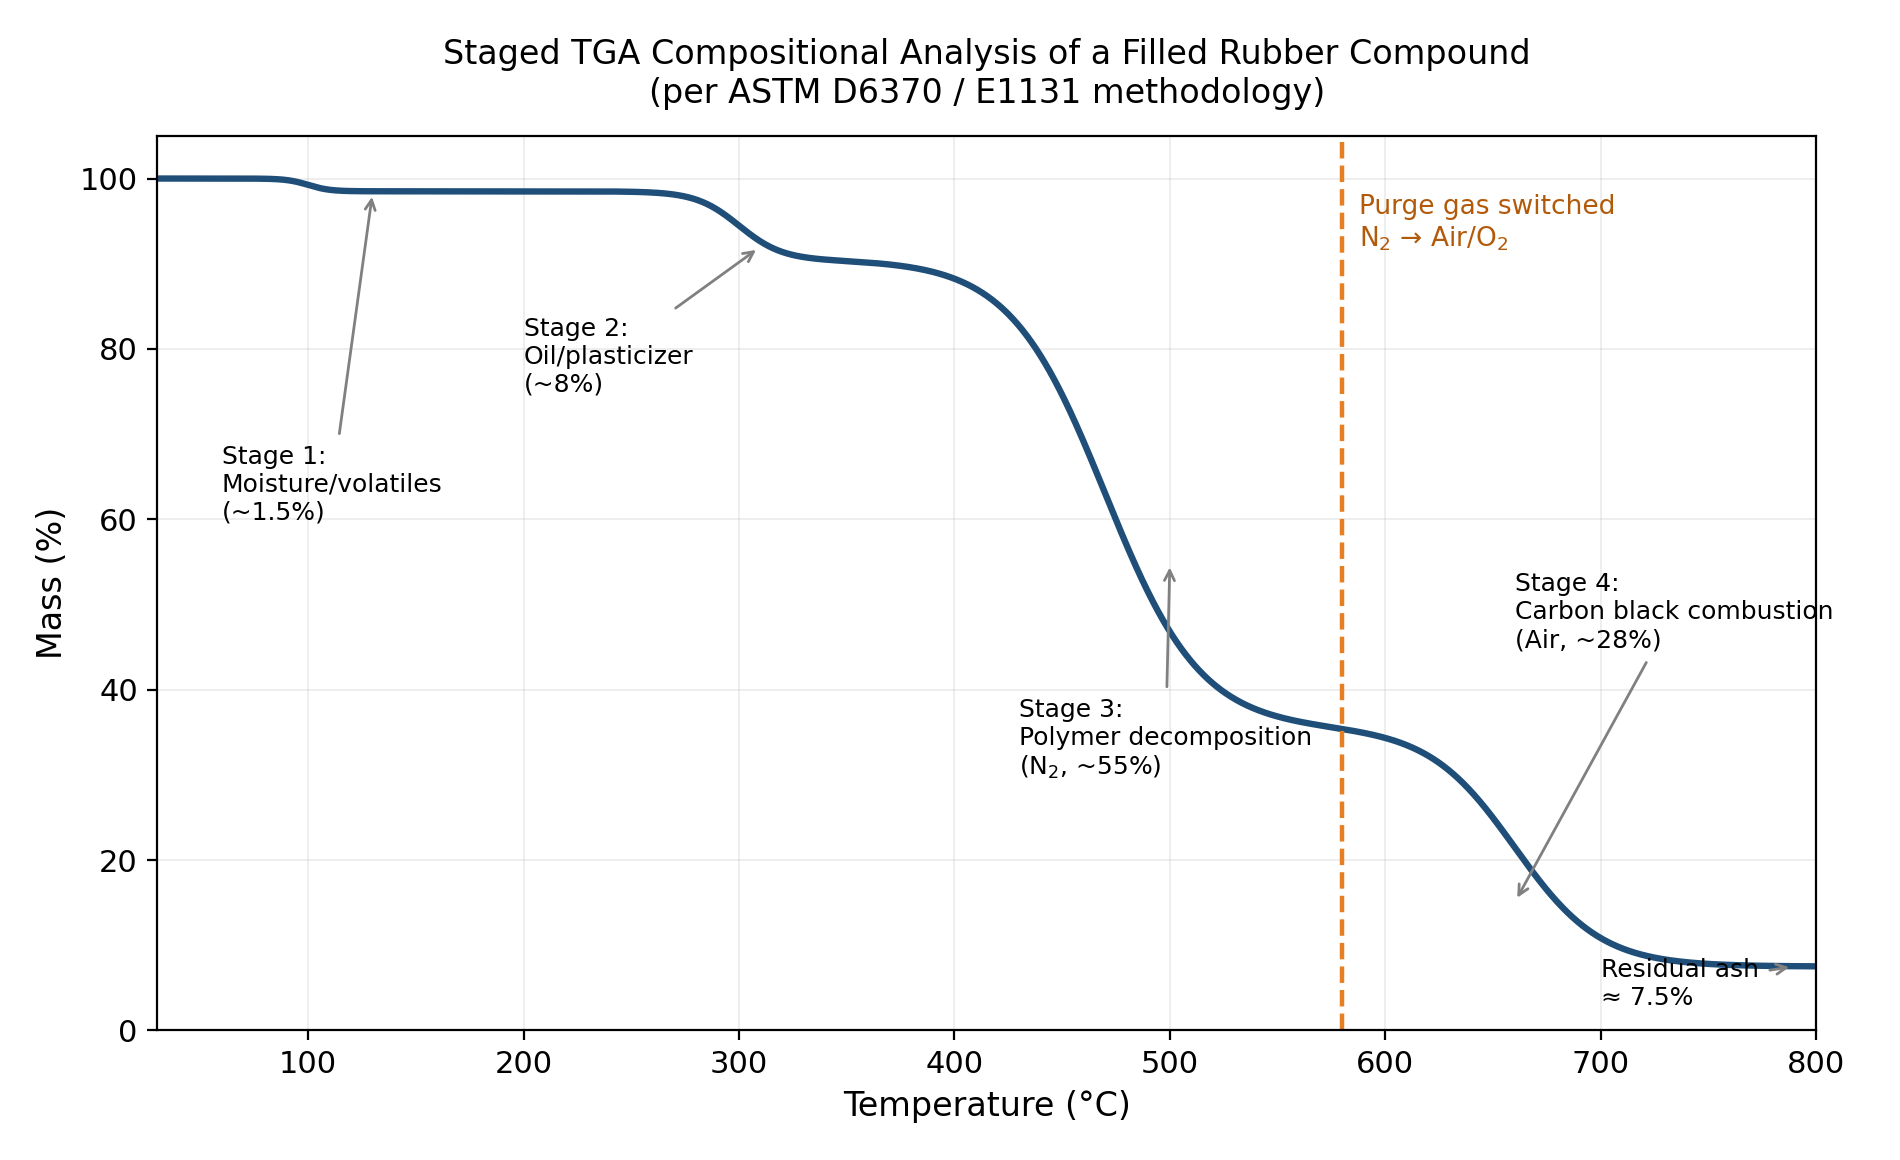
Figure 4. Staged TGA composition analysis of a filled rubber compound, showing moisture and volatiles loss, oil or plasticizer loss, polymer breakdown under nitrogen, the switch to an atmosphere with oxygen, carbon black burning, and final ash residue.
6. Key Standards Governing TGA Testing
TGA testing in the polymer and rubber industries is governed by a range of standardized methods, each meant for a specific use. Knowing which standard applies to a given material and goal is important for producing results that can be repeated and compared across laboratories.
| Standard | Scope |
|---|---|
| ASTM E1131 | Compositional analysis by thermogravimetry. Determines moisture and volatiles, polymer content, carbon black, and ash in a single staged test. |
| ISO 11358, Parts 1 to 3 | General principles, procedures, and specific methods for thermogravimetry of plastics. |
| ASTM D6370 | Compositional analysis of rubber compounds by TGA. Quantifies organics (oil and polymer), carbon black, and ash. |
| ASTM E1641 | Breakdown kinetics by thermogravimetry using the Ozawa/Flynn/Wall method, a method that compares data at a fixed level of conversion. Used to work out Arrhenius activation energy and the pre exponential factor from multiple heating rate TGA runs. |
| ASTM E698 | Kinetic parameters for thermally unstable materials using DSC and the Flynn/Wall/Ozawa method, a related kinetic approach applied to heat flow data rather than mass data. |
| ASTM D7582 | Proximate analysis of coal and coke by TGA, covering moisture, volatile matter, fixed carbon, and ash. Relevant where fuel or carbon based feedstocks overlap with polymer or composite work. |
| ASTM E2040 | Guidance on mass and temperature calibration, and on precision and bias considerations, for thermogravimetric measurements. |
Choosing the right standard depends on the goal of the test. Compositional breakdown of a filled plastic or rubber compound calls for E1131 or D6370. Working out how quickly a material will degrade at a given service temperature calls for a kinetic method such as E1641. Confirming that filler content matches specification is a straightforward use of the staged compositional approach described above. Laboratories that perform TGA testing to these standards typically operate under an ISO/IEC 17025 quality framework to make sure instrument calibration, method traceability, and result repeatability are all in order.
7. Kinetic Analysis: Estimating Thermal Stability and Service Life
TGA is not limited to single temperature scan testing. When a material is heated at several different, constant heating rates, with a minimum of three typically needed, the resulting shift in breakdown temperature with heating rate can be used to calculate the kinetic values that govern the breakdown reaction. Most importantly, this includes the Arrhenius activation energy, a measure of how much energy is needed to trigger the reaction.
The general idea is that as the heating rate increases, the temperature at which a given amount of breakdown occurs also increases. By plotting this relationship across several heating rates, the activation energy of the breakdown reaction can be worked out using established kinetic models, including:
-
The Ozawa/Flynn/Wall (OFW) method, an approach formalized in ASTM E1641, which plots the logarithm of heating rate against the inverse of temperature at a fixed degree of conversion, assuming first order breakdown kinetics.
-
The Kissinger method, which uses the shift in DTG peak temperature with heating rate to calculate activation energy, based on the temperature of maximum breakdown rate at each heating rate.
-
The Kissinger Akahira Sunose (KAS) and Friedman methods, additional approaches frequently used in academic and applied polymer degradation research, often applied alongside OFW and Kissinger to check results against each other, since different models can give somewhat different activation energy values for the same dataset.
Once activation energy is known, it can be used, following practices such as ASTM E1877 which builds on E1641 kinetic data, to estimate a material's expected service life at a given operating temperature, or the other way around, the maximum service temperature for a target lifetime. This kinetic approach has long been applied to wire and cable insulation materials, where ANSI/ASTM procedures based on TGA derived activation energy offer a much faster alternative to traditional long duration oven aging tests, which can take weeks or months to produce comparable lifetime estimates.
It is worth noting that different kinetic models can produce different activation energy values from the same raw dataset, since each model makes different simplifying assumptions about reaction order and mechanism. For this reason, technical literature in this area frequently reports results from more than one method side by side, using agreement, or disagreement, between methods as a check on how reliable the derived kinetic values are, rather than relying on a single model alone.
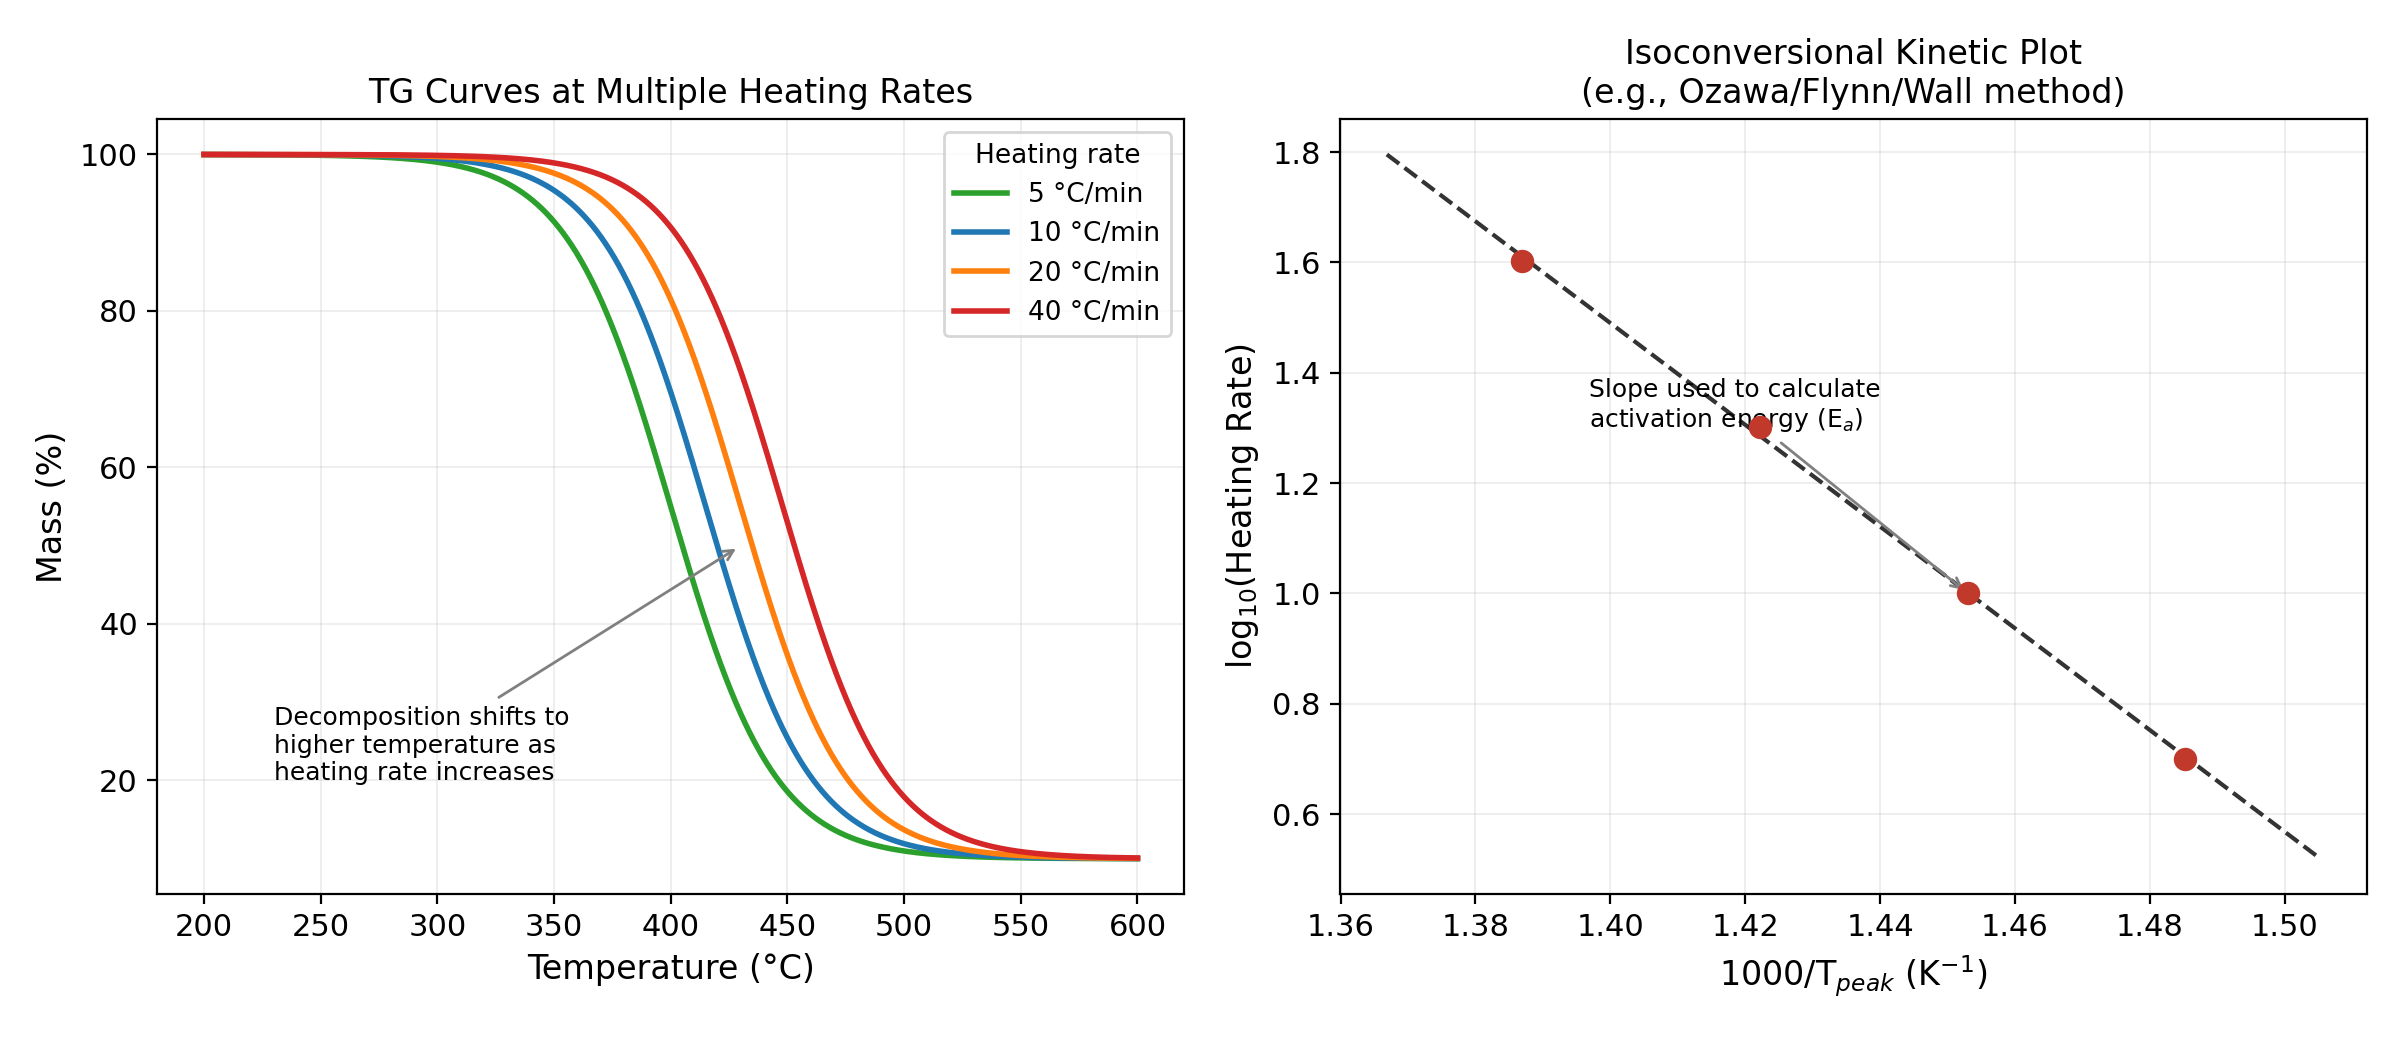
Figure 5. Left: TG curves for the same material at multiple heating rates, showing the breakdown curve shifting to higher temperature as heating rate increases. Right: the matching kinetic plot, whose slope is used to calculate activation energy.
8. Combined Techniques: TGA FTIR and TGA MS for Evolved Gas Analysis
TGA measures mass loss, but it does not by itself identify what is being lost. To answer that question, TGA is often combined with a gas analysis technique that examines the gases released from the sample in real time as they come off the furnace.
TGA FTIR connects the TGA furnace outlet to a Fourier transform infrared spectrometer through a heated transfer line, allowing the infrared spectrum of the released gas stream to be recorded continuously alongside the mass loss curve. Because different chemical groups and small molecules, such as water vapor, hydrocarbons, hydrogen chloride, and carbon dioxide, produce distinct infrared signals, this pairing allows specific breakdown products to be identified at the exact temperature at which they are released. This considerably strengthens the interpretation of a composition or breakdown study.
TGA MS performs a similar function using mass spectrometry rather than infrared spectroscopy to analyze released gases, offering additional sensitivity and the ability to detect species that may not have strong infrared signals.
Combining TGA with either of these evolved gas analysis techniques is particularly valuable for confirming the identity of an unknown mass loss step, for example telling apart plasticizer loss from low molecular weight polymer fragments, for investigating the root cause of an unexpected breakdown event, and for more definitive material or contaminant identification when used alongside differential scanning calorimetry (DSC) data.
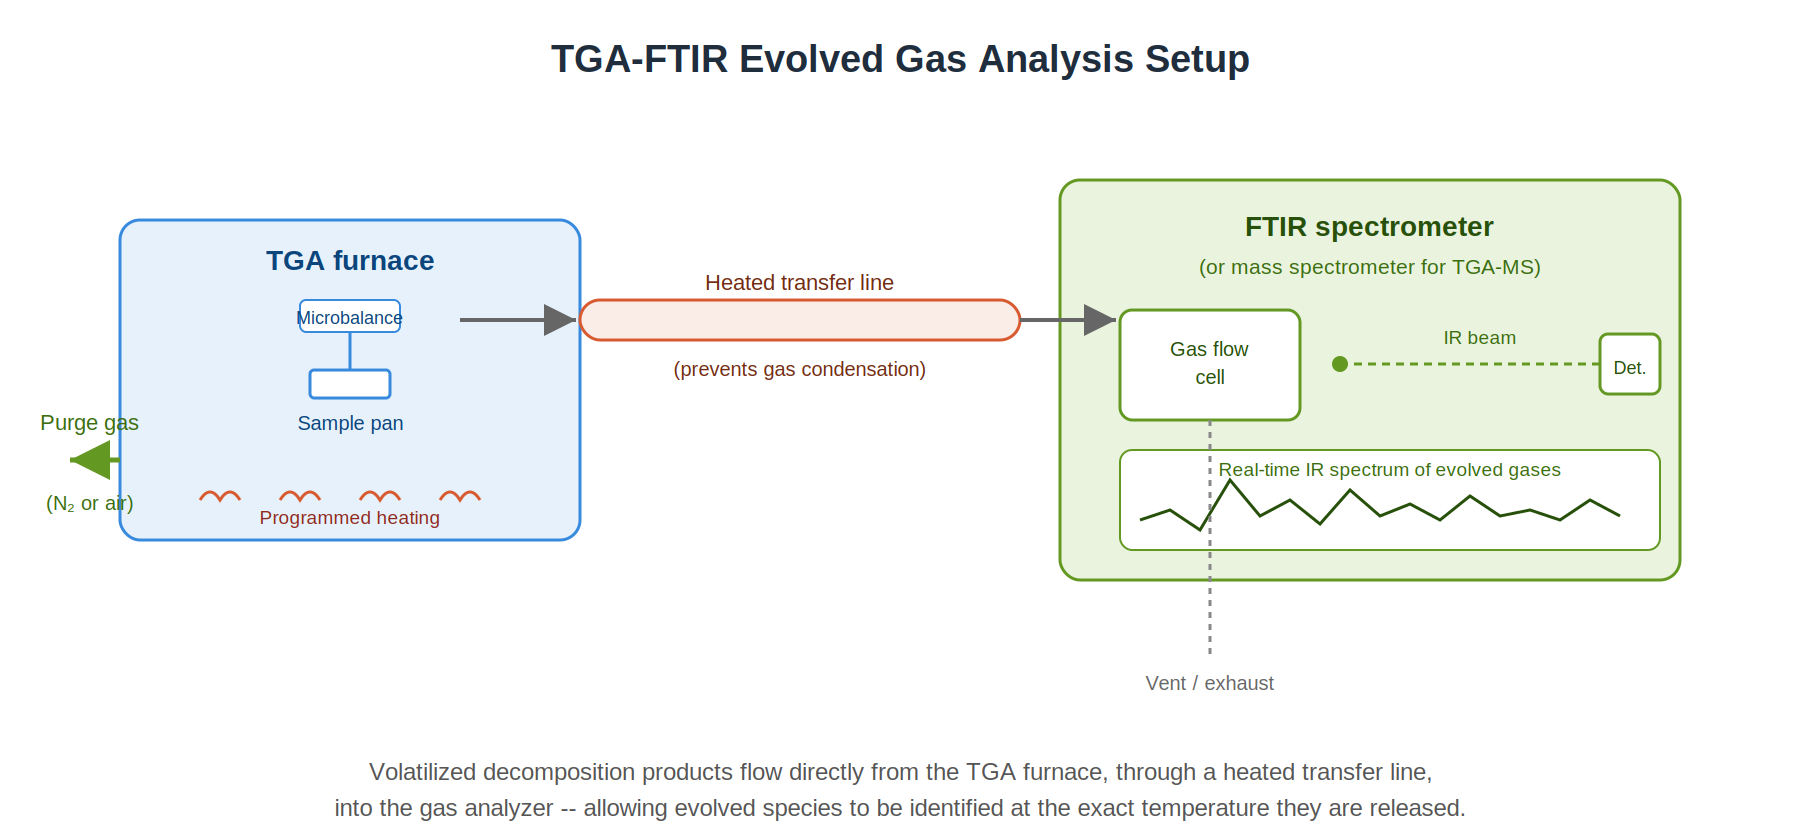
Figure 6. A diagram of a TGA FTIR evolved gas analysis setup. The TGA furnace connects through a heated transfer line to an FTIR spectrometer, allowing real time identification of gases released during breakdown.
9. Industry Applications
The combination of thermal stability data and composition analysis makes TGA a practical, widely used tool across several stages of the polymer and rubber product lifecycle:
-
Quality control and incoming material verification. Manufacturers use TGA to confirm that incoming resin, compound, or masterbatch lots match their specified filler content, polymer ratio, or moisture level, flagging out of specification material before it enters production.
-
Formula development and troubleshooting. During compound development, TGA helps engineers compare how additives, stabilizers, or filler amounts shift the breakdown onset temperature, supporting formula decisions aimed at improving high temperature performance or processing stability.
-
Failure analysis. When a polymer part fails in service, through cracking, discoloration, or unexpected degradation, TGA can help determine whether the material's composition matches specification, whether contamination is present, or whether the part was exposed to temperatures beyond its rated thermal stability.
-
Recycled and reclaimed material characterization. As recycled content becomes more common in plastic and rubber formulas, TGA is used to confirm polymer content, detect leftover contaminants, and compare the thermal breakdown behavior of recycled feedstock against virgin material benchmarks.
-
Composite and filled material analysis. For fiber reinforced composites and mineral filled compounds, TGA provides a straightforward way to quantify resin content versus reinforcement or filler amount, which is directly useful for confirming manufacturing consistency and comparing suppliers.
-
Rubber compound analysis. In tire, seal, and molded rubber manufacturing, TGA testing based on ASTM D6370 is a standard quality control tool for confirming oil, polymer, carbon black, and ash content against target formulas.
-
Wire, cable, and insulation qualification. Kinetic TGA methods support thermal life estimation for insulating polymers used in wire and cable, offering a faster alternative to extended oven aging protocols for comparing candidate materials or confirming long term thermal ratings.
-
Packaging and consumer goods. TGA supports moisture content determination, additive and filler verification, and thermal stability assessment for polymer films, containers, and molded parts meant for specific processing or end use temperature ranges.
10. Best Practices for Reliable TGA Testing
Because TGA results are sensitive to test conditions, several practical factors affect the accuracy, repeatability, and comparability of results:
-
Sample size and shape. Very small, thin, or finely divided samples generally allow for more even heat transfer and gas movement than large, dense samples, reducing the risk of a temperature lag between the inside of the sample and the furnace atmosphere.
-
Heating rate. Slower heating rates generally give sharper separation between overlapping breakdown steps but take longer to run. Faster heating rates shift breakdown to higher apparent temperatures and can merge closely spaced events. Heating rate must also be kept consistent, and for kinetic analysis, deliberately varied across multiple runs, depending on the goal of the test.
-
Purge gas choice and flow rate. The choice between an atmosphere without oxygen, using nitrogen, and one with oxygen, using air, fundamentally changes the breakdown pathway observed. Flow rate affects how well released gases are carried away from the sample environment, which can in turn affect secondary reactions at the sample surface.
-
Sample pan material. The pan material must be chemically stable with the sample and stable at the highest test temperature. Platinum and alumina pans are common choices, picked partly based on whether the sample might react with or stick to the pan surface.
-
Instrument calibration. Both temperature and mass calibration must be checked regularly, typically using certified reference materials with known melting points or magnetic transition points, to make sure the reported onset and peak temperatures are accurate and traceable.
-
Baseline correction. Buoyancy effects from the changing density of the purge gas as temperature rises can cause small apparent mass changes unrelated to the sample itself. A blank, empty pan, baseline run is typically subtracted to correct for this.
Following a consistent, documented procedure for these factors, as set out in standards such as E1131, D6370, or E1641, is what allows TGA results to be meaningfully compared across different samples, laboratories, and time periods.
11. Limits and Complementary Techniques
While TGA is a powerful tool for thermal stability and composition analysis, it has built in limits that matter when interpreting results.
TGA measures mass change only. It does not directly detect thermal transitions that do not involve a change in mass, such as glass transition temperature, melting point, or crystallization behavior. These transitions are instead studied using differential scanning calorimetry (DSC), which measures heat flow rather than mass, and is often used alongside TGA to build a more complete thermal picture of a polymer.
TGA also cannot, on its own, identify the chemical nature of the material or the gases it releases. It reports how much mass was lost and at what temperature, but not what that mass loss is made of chemically. This is why TGA is often paired with FTIR or mass spectrometry, as discussed above, for evolved gas analysis, and with techniques such as Fourier transform infrared spectroscopy on the bulk material itself, when definitive chemical identification is needed.
Finally, because TGA composition analysis relies on distinct, non overlapping breakdown temperature windows for each component, materials in which two or more components break down in the same temperature range, for example certain mineral fillers that themselves lose mass within the polymer breakdown region, need extra correction or complementary analysis, such as separate ashing, X ray fluorescence, or combined thermogravimetric and differential thermal analysis, to avoid crediting mass loss to the wrong component.
Used as part of a broader thermal analysis toolkit, alongside DSC, dynamic mechanical analysis (DMA), and spectroscopic methods, TGA provides some of the most direct, quantitative evidence available for understanding how a polymer will behave, and what it is actually made of, under heat.
Conclusion
Thermogravimetric analysis gives the polymer, plastics, and rubber industries a single, well established technique for answering two closely related questions: how thermally stable is this material, and what is it actually made of? By tracking mass loss against a controlled temperature program, and by reading the resulting TG and DTG curves against established standards such as ASTM E1131, ISO 11358, and ASTM D6370, engineers and quality teams can quantify moisture, volatiles, polymer content, and filler amount from a single test run. Extended to multiple heating rates and kinetic models such as Kissinger and Ozawa/Flynn/Wall, the same underlying measurement supports activation energy calculations and service life estimation. Paired with evolved gas analysis techniques like TGA FTIR or TGA MS, and used alongside complementary methods such as DSC, TGA remains one of the most practical and informative tools available for polymer characterization, quality control, and failure analysis across the material lifecycle.
Relevant Testshine Product
Bring Precision Thermal Analysis to Your Materials Lab with the Testshine TS-TGA101 Thermogravimetric Analyzer
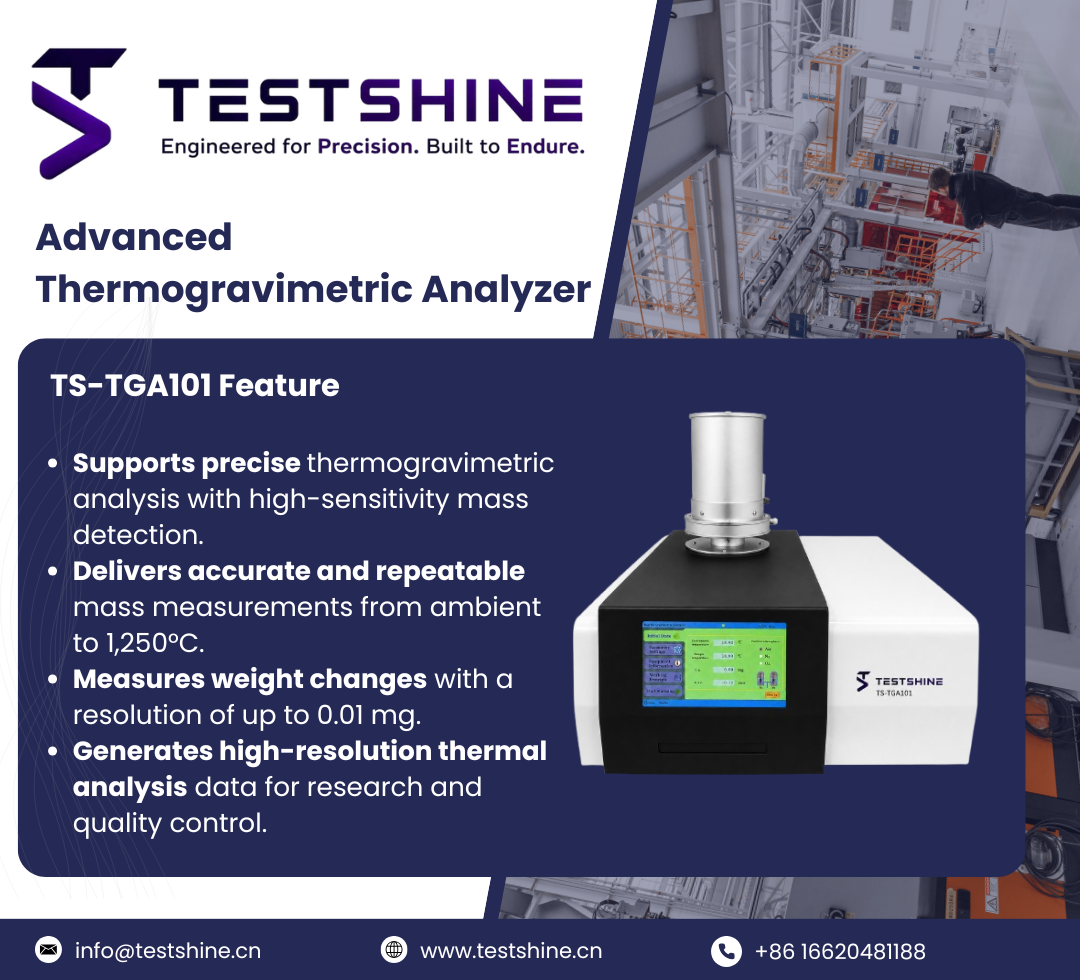
Every principle covered in this article, including TG/DTG curve interpretation, ASTM E1131 and D6370 compositional analysis, and multi-heating-rate kinetic studies, depends on having an instrument that can deliver that mass-loss data reliably, run after run. The Testshine TS-TGA101 Thermogravimetric Analyzer is built around exactly that kind of measurement.
Why it fits the TGA workflow described above:
- Wide, precise temperature range: Room temperature to 1,250°C with 0.01°C resolution and ±0.1°C fluctuation, covering the full breakdown range of polyolefins, PVC, PTFE, nylons, and filled rubber compounds.
- Flexible heating rate control: Programmable 0.1–100°C/min heating rates with PID temperature control, supporting both routine TG scans and the multiple-heating-rate runs needed for Kissinger and Ozawa/Flynn/Wall kinetic analysis.
- High-resolution weighing system: 0.01 mg weighing accuracy across a 0.01 mg–3 g measurement range, extendable to 30 g, suited to the staged compositional analysis described in ASTM E1131 and D6370.
- Isothermal hold capability: Constant-temperature operation for up to 300 minutes, useful for isothermal decomposition studies and atmosphere-switch composition runs.
The TS-TGA101 is built for thermal stability and composition testing across polymer, rubber, coatings, and pharmaceutical materials, applications that rely on the same TG/DTG, mass-loss, and Arrhenius kinetic principles covered in this article. You can also talk to a Testshine applications engineer about your specific test method.
References
-
ASTM International. E1131-25. Standard Test Method for Compositional Analysis by Thermogravimetry. West Conshohocken, PA. https://www.astm.org/standards/E1131.htm
-
ASTM International. D6370-99(2019). Standard Test Method for Rubber—Compositional Analysis by Thermogravimetry (TGA). West Conshohocken, PA. https://www.astm.org/Standards/D6370.htm
-
International Organization for Standardization. ISO 11358-1:2022. Plastics — Thermogravimetry (TG) of Polymers — Part 1: General Principles. Geneva. https://www.iso.org/standard/79999.html
-
International Organization for Standardization. ISO 11358-2:2021. Plastics — Thermogravimetry (TG) of Polymers — Part 2: Determination of Activation Energy. Geneva. https://www.iso.org/standard/80001.html
-
International Organization for Standardization. ISO 11358-3:2021. Plastics — Thermogravimetry (TG) of Polymers — Part 3: Determination of the Activation Energy Using the Ozawa-Friedman Plot and Analysis of the Reaction Kinetics. Geneva. https://www.iso.org/standard/80002.html
-
ASTM International. E1641-18. Standard Test Method for Decomposition Kinetics by Thermogravimetry Using the Ozawa/Flynn/Wall Method. West Conshohocken, PA. https://www.astm.org/Standards/E1641.htm
-
ASTM International. E698-23. Standard Test Method for Kinetic Parameters for Thermally Unstable Materials Using Differential Scanning Calorimetry and the Flynn/Wall/Ozawa Method. West Conshohocken, PA. https://store.astm.org/e0698-23.html
-
ASTM International. D7582-15(2023). Standard Test Methods for Proximate Analysis of Coal and Coke by Macro Thermogravimetric Analysis. West Conshohocken, PA. https://store.astm.org/d7582-15.html
-
ASTM International. E2040-19. Standard Test Method for Mass Scale Calibration of Thermogravimetric Analyzers. West Conshohocken, PA. https://www.astm.org/Standards/E2040.htm
-
ASTM International. E1877-21. Standard Practice for Calculating Thermal Endurance of Materials from Thermogravimetric Decomposition Data. West Conshohocken, PA. https://store.astm.org/e1877-21.html
-
Kissinger, H.E. "Reaction Kinetics in Differential Thermal Analysis." Analytical Chemistry, 1957, 29(11), 1702–1706. https://doi.org/10.1021/ac60131a045
-
Flynn, J.H.; Wall, L.A. "A Quick, Direct Method for the Determination of Activation Energy from Thermogravimetric Data." Journal of Polymer Science Part B: Polymer Letters, 1966, 4(5), 323–328. https://doi.org/10.1002/pol.1966.110040504
-
Ozawa, T. "A New Method of Analyzing Thermogravimetric Data." Bulletin of the Chemical Society of Japan, 1965, 38(11), 1881–1886. https://doi.org/10.1246/bcsj.38.1881
-
Friedman, H.L. "Kinetics of Thermal Degradation of Char-Forming Plastics from Thermogravimetry: Application to a Phenolic Plastic." Journal of Polymer Science Part C: Polymer Symposia, 1964, 6(1), 183–195. https://doi.org/10.1002/polc.5070060121
-
International Organization for Standardization. ISO/IEC 17025:2017. General Requirements for the Competence of Testing and Calibration Laboratories. Geneva. https://www.iso.org/standard/66912.html