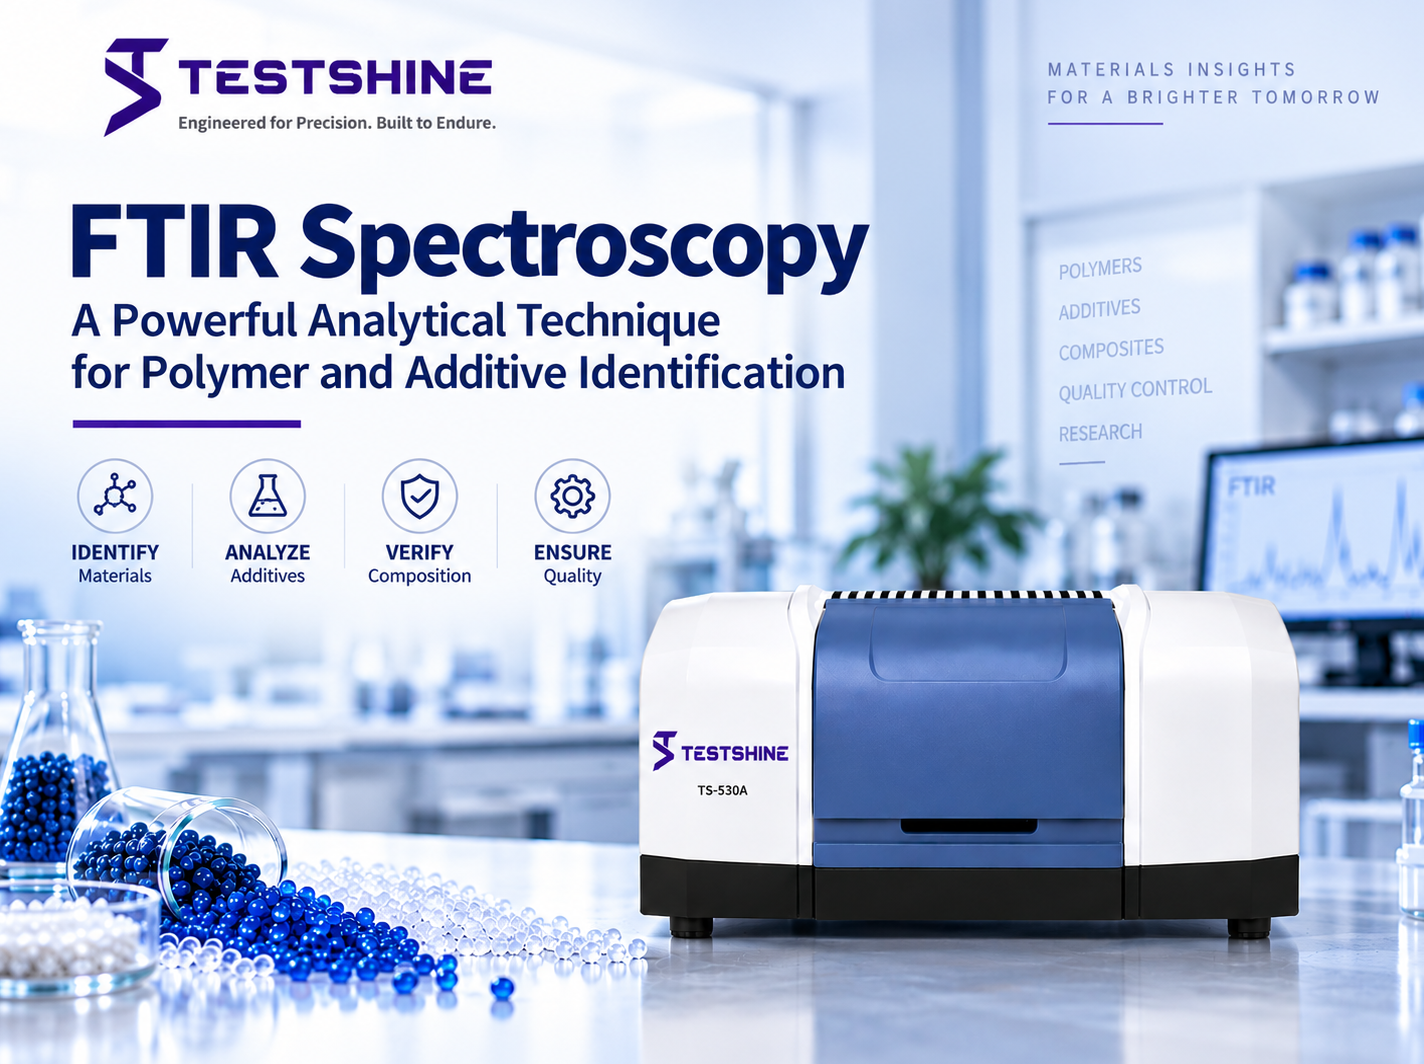
FTIR Spectroscopy: A Powerful Analytical Technique for Polymer and Additive Identification
Introduction
Fourier transform infrared (FTIR) spectroscopy is one of the most widely used techniques for identifying organic and inorganic materials. It is usually the first tool a lab reaches for when answering a simple but important question: what is this material made of? [1]
Polymers are rarely pure. A commercial plastic part is a mixture: a base resin combined with stabilisers, plasticisers, lubricants, flame retardants, pigments, mineral fillers and reinforcing fibres. Each of these ingredients affects how the part is processed, how long it lasts, and whether it meets the specification it was ordered against. FTIR spectroscopy lets a lab identify the polymer type, detect many of these added ingredients, and track chemical changes caused by ageing, oxidation or processing. It usually takes only minutes, and often does not damage the sample.
The technique is used across essentially every sector that touches polymeric materials:
- Plastics and packaging: checking incoming resin, examining multilayer film structure, and investigating contamination and gels
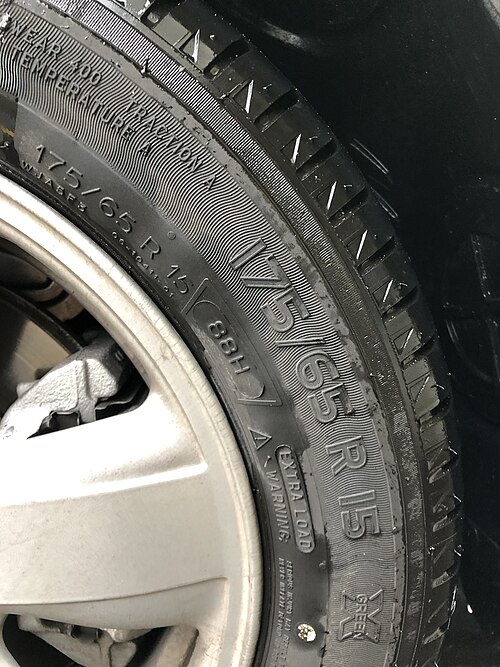
- Automotive and rubber: identifying elastomers, checking EPDM composition, and studying weathering
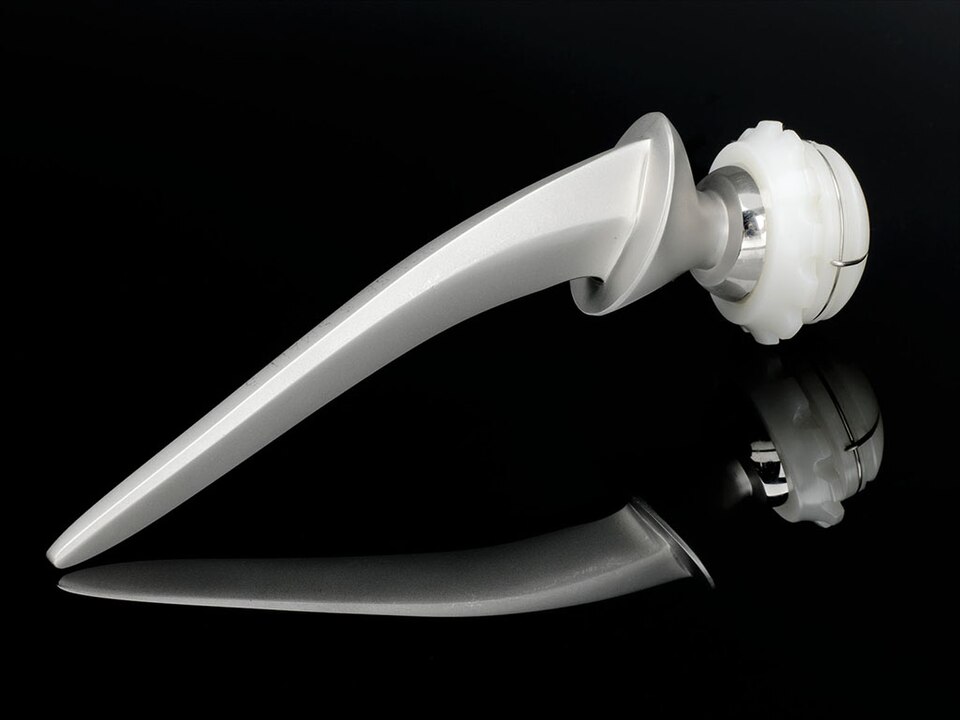
- Medical devices: assessing oxidation in polyethylene implant parts
- Pharmaceuticals: confirming the identity of raw materials and excipients
- Wire, cable and electrical: monitoring unsaturation and degradation in polyolefins
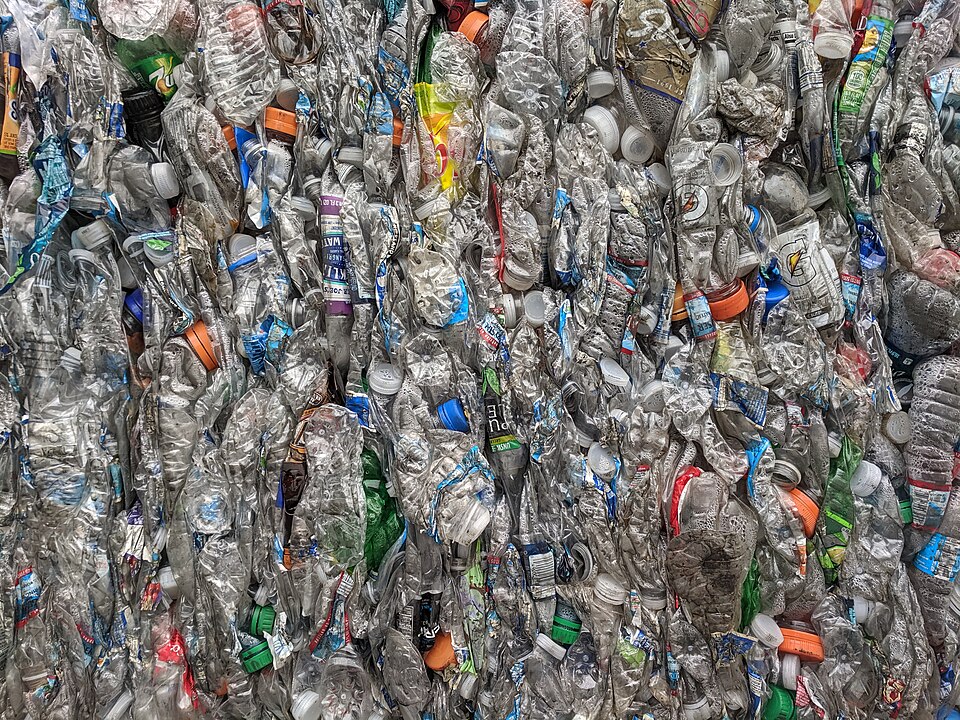
- Recycling and environmental labs: sorting polymers and identifying microplastics
- Coatings, adhesives and composites: studying resin chemistry, cure state and failures
This article explains how FTIR works, which sampling method suits which sample type, what the spectra actually reveal about polymers and additives, which international standards apply, and how to avoid the common errors that lead to wrong identifications. It is written for lab users, engineers, researchers, quality control teams and technical decision makers who want to understand the method, not just operate the instrument.
Understanding FTIR Spectroscopy
The physical principle
Molecular bonds vibrate in different ways: they stretch, bend, rock and twist, at frequencies set by the mass of the atoms involved and the strength of the bond between them. When infrared light passes through or into a sample, light at a frequency that matches one of these vibrations can be absorbed. A vibration only shows up in an infrared spectrum if it changes the distribution of electrical charge across the molecule. This is why strongly polar bonds, such as carbon oxygen double bonds and bonds between oxygen or nitrogen and hydrogen, produce strong infrared signals, while bonds between two identical atoms produce none.
The result is an absorption spectrum plotted against wavenumber (cm⁻¹), a unit equal to the reciprocal of wavelength. Because the pattern of bands reflects both which chemical groups are present and how they are connected, the spectrum acts like a chemical fingerprint. Infrared spectroscopy is used for identification across the range from 4000 cm⁻¹ down to 50 cm⁻¹, and the same sampling methods are often useful above 4000 cm⁻¹, in the near infrared region [1].
Why it is called "Fourier transform"
Older, dispersive instruments split infrared light into individual wavelengths using a grating and measured them one at a time. An FTIR spectrometer instead uses a device called an interferometer, most commonly built in a Michelson layout with a beamsplitter, a fixed mirror and a moving mirror. All wavelengths reach the detector at the same time, and the detector records what is called an interferogram: a signal that changes with the path difference between the two mirrors. A mathematical step called a Fourier transform then converts that signal into the spectrum most people recognise.
This design gives FTIR three advantages over dispersive instruments that are well established in the literature: more light reaches the detector because no narrow slits are needed (the throughput or Jacquinot advantage), all frequencies are measured at once (the multiplex or Fellgett advantage), and band positions are measured very precisely using an internal reference laser (the Connes advantage) [16]. Together, these give FTIR the strong signal to noise performance and reproducible band positions that make library based polymer identification practical.
Resolution, scans and what they actually buy you
Two settings matter most for everyday work:
- Spectral resolution controls how well closely spaced bands can be told apart. It is set by the largest path difference the interferometer can reach. Polymer identification is normally done at 4 cm⁻¹, which is more than enough to separate the broad bands typical of solid samples. Higher resolution costs time and reduces the signal to noise ratio, and is mainly needed for gas samples or very narrow features.
- The number of scans added together improves the signal to noise ratio. The improvement follows the square root of the number of scans, so there comes a point where adding more scans gives little extra benefit.
One common assumption is worth correcting. Errors in peak position have historically been overstated. A detailed study found that typical positional error at 4 cm⁻¹ resolution is only about 1 cm⁻¹, and that resolution and differences between instruments have only a small effect on peak position. The main sources of error are band saturation, interference from water vapour, and general noise, not the resolution setting itself [16]. In practice, this means labs should focus on how the sample is presented and how well the system is purged, rather than chasing higher resolution numbers.
Why Polymer and Additive Identification Matters
Polymer identity is not merely academic. It determines thermal and chemical resistance, mechanical behaviour, permeability, recyclability and regulatory status. The practical consequences of getting it wrong are immediate:
Incoming material verification. Resin supplied against a specification may be a different grade, a regrind blend, or an entirely different polymer. An ATR measurement taking about two minutes on a pellet catches substitution before it reaches the extruder.
Failure and contamination analysis. Gels, specks, black spots and delamination in film are among the most common quality complaints in the film converting industry. Infrared microspectroscopy is the standard method for identifying these inclusions and for checking that the layers of a coextruded barrier film are present and in the right order. A missing or broken layer often explains why a barrier structure is not performing [4].
Degradation monitoring. Oxidation, hydrolysis and exposure to light all produce new infrared bands, most notably in the carbonyl region. Because these chemical changes appear before any loss of mechanical strength can be measured, infrared analysis gives early warning that a formulation or stabiliser package is not working well enough [6].
Regulatory and pharmacopoeial identity. Infrared spectroscopy is a recognised identity test in pharmaceutical practice. When a monograph calls for it, the test must be used to confirm the identity of the material [14].
Recycling and environmental compliance. Sorting mixed plastic waste and studying microplastics both depend on identifying the chemical makeup of the polymer, not just its appearance. International standards now specifically cover the combination of microscopy and vibrational spectroscopy for this purpose [11].
FTIR Sampling Techniques for Polymers
Choosing the sampling technique is the single most consequential decision in polymer FTIR. The spectrometer is usually not the limiting factor; sample presentation is.
Attenuated total reflectance (ATR)
In ATR, the infrared beam is directed into a crystal with a high refractive index (commonly diamond, zinc selenide or germanium) at an angle that causes total internal reflection. At each reflection, a small amount of the light, called an evanescent wave, extends a short distance beyond the crystal surface into the sample pressed against it, and the sample absorbs from that field.
ATR has become the default for polymer identification because it needs essentially no sample preparation: a pellet, a film, a moulded part surface, a powder or a viscous liquid is simply pressed against the crystal. ISO 4650 recognises reflectance (ATR) alongside transmission as a method for rubber identification, and provides a comparison of the two [5].
The key limitation is that ATR only probes a thin layer near the surface, typically just a few micrometres deep. How deep the light penetrates depends on the refractive index of the crystal and the sample, the angle of the beam, and importantly, the wavelength. Because penetration increases with wavelength, bands at low wavenumbers appear relatively stronger in ATR than in transmission. Strong bands can also shift position slightly, because the sample's refractive index changes sharply across an absorption band, an effect called anomalous dispersion. For poly(methyl methacrylate), a shift of several wavenumbers in the carbonyl band between transmission and ATR has been documented, and correction methods reduce but do not always remove this effect [17]. This is why comparing an ATR spectrum directly against a library built from transmission spectra, without correction, can give a poor match.
Transmission
Transmission remains the reference technique for quantitative work because the path length can be defined and controlled, which is what Beer's law requires [2]. Polymers are presented as cast or pressed films, microtomed sections, or solutions in an appropriate cell. Several quantitative polymer standards are written around transmission measurement of films of known thickness, including the determination of vinyl and trans unsaturation in polyethylene [8] and the determination of ethylene content in EPM and EPDM rubbers [9].
The practical constraint is thickness. Films must be thin enough that the strongest bands do not saturate. A saturated band carries no usable intensity information, and saturation is one of the main recognised sources of error in FTIR [16].
Diffuse and specular reflectance
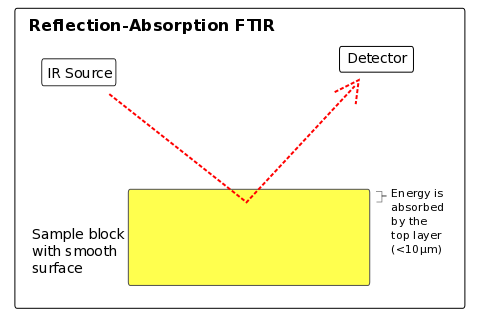
Diffuse reflectance, often called DRIFTS, suits powders and rough, matte surfaces. The sample is often mixed into a material that does not itself absorb infrared light. Specular and external reflectance allow measurement of flat, glossy surfaces, and of objects that must not be touched or pressed, without contact. Reflectance spectra usually need mathematical correction before they can be compared with a library, and their quality is sensitive to surface shape and to scattering from fillers and pigments [18].
Infrared microspectroscopy
Attaching an infrared microscope to the spectrometer allows spectra to be collected from areas just a few tens of micrometres across. This is the standard method for identifying specks and inclusions in film, and for examining the individual layers of a coextruded barrier structure in cross section [4]. It is also the basis of microplastic analysis, where microscopy combined with vibrational spectroscopy is used to size, count and chemically identify particles [11].
Comparing the techniques
| Sampling technique | Typical sample form | Depth probed | Main strength | Main limitation |
|---|---|---|---|---|
| ATR | Pellets, films, mouldings, powders, viscous liquids | Near surface (a few micrometres) | Needs little preparation; fast identification [5] | Only measures the surface; penetration depends on wavelength and bands can shift [17] |
| Transmission | Cast or pressed films, microtomed sections, solutions | Full thickness | Defined path length, good for quantitative work [2][8][9] | Needs sample preparation; risk of band saturation [16] |
| Diffuse reflectance | Powders, rough surfaces | Variable, depends on the sample | Handles powders with little preparation | Sensitive to particle size and packing |
| External / specular reflectance | Flat, glossy surfaces that cannot be touched | Surface and a thin layer just below it | No contact needed, non destructive [18] | Spectrum can be distorted; needs correction [18] |
| Infrared microspectroscopy | Specks, inclusions, layers, microplastic particles | A small, targeted region | Spatially resolved identification [4][11] | Slower; needs a skilled operator |
Identifying Additives, Fillers and Reinforcements
FTIR responds to the whole mixture in a sample, not just the base resin. Whether a given additive can be detected depends on how much of it is present, how strongly it absorbs infrared light, and whether its bands are hidden by the polymer's own spectrum.
Mineral fillers are usually easy to spot. Calcium carbonate, talc, silica and similar fillers are present at levels of a few percent or more, and they produce strong, distinctive bands that sit on top of the polymer spectrum. Their presence is often the first thing an experienced analyst notices in a spectrum that looks like polypropylene, plus something extra.
Plasticisers are usually easy to detect in PVC. Phthalate and adipate plasticisers are typically present at high levels and add clear ester carbonyl and carbon oxygen bands to a spectrum that would otherwise show none.
Carbon black is a special case. It has no infrared bands of its own, but it absorbs broadly across the mid infrared region, which raises the baseline and weakens the polymer spectrum underneath it. Compounds heavily loaded with carbon black are among the hardest routine samples in FTIR.
Stabilisers, antioxidants and slip agents are usually the hardest to see. They are used at low levels, often well below one percent, and their bands are weak and hidden under the polymer's own spectrum. Measuring the moulded part directly with FTIR will often fail to reveal them. The standard approach is to extract the additives from the plastic first and then analyse the extract. ASTM International maintains a practice covering exactly this kind of extraction from polyolefin plastics [10]. Where the goal is to measure the amount of a specific additive, separation methods are normally used instead: for example, liquid chromatography for antioxidants and erucamide slip additives in polyethylene, and gas chromatography for the small plasticiser molecules used in PVC [10].
A realistic summary for planning purposes:
| Formulation component | Typical detectability by direct FTIR | Recommended approach |
|---|---|---|
| Base polymer | High | Direct ATR or transmission measurement, library matching [1] |
| Mineral filler (e.g. carbonate, silicate) | High at typical loadings | Direct measurement; subtract or reference the polymer spectrum |
| Plasticiser in flexible PVC | High at typical loadings | Direct measurement; confirm and quantify using chromatography [10] |
| Copolymer comonomer content | Moderate to high | Quantitative transmission methods with calibration [2][9] |
| Pigments and colourants | Variable | Direct measurement where inorganic bands exist; carbon black can hide the spectrum |
| Antioxidants, light stabilisers, slip additives | Low at working concentrations | Extraction followed by analysis of the extract; confirmation by chromatography [10] |
Factors Affecting FTIR Results
Most misidentifications trace back to a small number of avoidable causes.
Poor contact with the ATR crystal. The measuring field extends only a few micrometres beyond the crystal, so even a small air gap reduces or removes the signal. Hard, curved or textured samples are the usual cause. Studies on reproducibility have shown that differences in contact pressure and contact angle change the relative strength of bands in ATR spectra.
The surface is not the same as the bulk material. ATR measures whatever is on the surface: mould release agent, additives that have migrated there, contamination from handling, or an oxidised layer. If the question is about the bulk material, cut a section through the sample or clean the surface deliberately first.
Penetration and band shifts that depend on wavelength. The ratio of band intensities in ATR differs from transmission, and strong bands can shift by several wavenumbers due to anomalous dispersion. Correction methods help, but only work well when the difference in refractive index between the sample and the ATR crystal is large enough [17].
Band saturation. Films that are too thick produce bands with flattened tops, which ruins both quantitative accuracy and the accuracy of peak positions. Saturation is one of the main recognised sources of error in FTIR measurement [16].
Water vapour and carbon dioxide in the air. Interference from water vapour is also a recognised source of error [16]. Water vapour produces sharp features around 1600 cm⁻¹ and above 3500 cm⁻¹, which can be mistaken for bands from the sample. Purging the instrument consistently, ideally with dry air or nitrogen, and collecting a background measurement under the same conditions, are the usual remedies.
Fillers, pigments and scattering. Highly filled or darkly pigmented materials produce baseline shifts caused by infrared light scattering from fillers and colourants, which reduces spectral quality [18].
Degradation and weathering. Aged materials accumulate oxidation products that change the spectrum, which is useful when you are studying degradation and a nuisance when you are trying to identify the base polymer.
Relying too heavily on library match scores. A matching algorithm compares a spectrum against whatever is stored in the library. A high score against a limited library is not proof of correct identification. Where classification is difficult, statistical methods such as principal component analysis have been applied to polymer spectra, and their strengths and limitations for identifying and studying degraded polymers are actively discussed in published research [18].
Industry Applications
Plastics processing and packaging
Checking incoming resin, confirming how much regrind is in a blend, identifying gels and black specks, and analysing coextruded barrier films layer by layer are everyday applications. For multilayer structures, infrared microspectroscopy through a cross section shows whether the barrier layer is present, continuous and made of the expected material. A missing layer, a hole in a layer, or poor coextrusion will explain a barrier failure [4].
Rubber and automotive components
Identifying elastomers is standardised. ISO 4650 covers rubbers and thermoplastic elastomers in their raw, vulcanised and unvulcanised states, using pyrolysates, cast films or moulded films, measured by transmission or ATR [5]. For ethylene propylene rubbers, ASTM D3900 provides a method for measuring ethylene content, with four variants to deal with interference from additives and polymerised diene units [9].
Medical devices and implants
Oxidation of polyethylene bearing surfaces is a well understood degradation pathway, and ASTM F2102 provides the standard infrared method for measuring it, including tracking the oxidation index at different depths through a microtomed section [7].
Pharmaceutical manufacturing
Infrared spectroscopy is one of the identification tests used to confirm the chemical identity of materials against their monographs [14]. In these settings, the software and record keeping side of the instrument carries as much regulatory weight as the measurement itself [15].

Recycling, waste sorting and environmental laboratories
Chemical identification is the basis of sorting polymers. In the environmental field, ISO 16094-2 sets out principles for investigating microplastics in drinking water and other water with low levels of suspended solids, using microscopy combined with vibrational spectroscopy. It covers sizing and counting particles from 1 µm to 5000 µm and identifying the main industrial and environmental polymers [11]. The standard also states its own limits: it does not cover the substances added to or stuck onto microplastic surfaces, nor does it cover measuring particle shape [11].
Durability, weathering and cultural heritage
Studies of long term performance use infrared analysis to follow the chemistry of ageing [6]. The same challenge shows up in conservation science, where FTIR is used to identify polymers in museum collections, because identification determines how an object should be stored and treated. Researchers there have systematically tested ATR and external reflectance on three dimensional plastic objects, including how surface condition and signal to noise ratio affect the success of identification [18].
Supporting Quality Control and Product Development
Quality control. The strongest use of FTIR in QC is comparison, not identification from scratch. A reference spectrum of the approved material becomes the acceptance standard. Incoming lots are compared against it, and any differences are investigated. Because an ATR measurement takes only minutes and uses no consumables, the method scales well to routine checking of every lot.
Process control. Comparing material before and after processing detects heat damage, contamination picked up on the line, and unwanted changes in composition. Measurements of unsaturation and methyl groups provide structural data on polyethylene grades that is directly useful for process control [8][10].
Product development. Formulation work benefits from tracking specific chemical changes, rather than waiting for the final mechanical test results. Oxidation indices and photoageing methods let developers compare stabiliser packages on a chemical basis, and spot differences before mechanical properties start to diverge [6][7].
Material comparison and benchmarking. Materials from competitors or alternative suppliers can be compared directly, spectrum against spectrum. Differences in filler type, plasticiser chemistry or copolymer content are often visible right away.
Failure investigation. In failure analysis, FTIR answers the composition questions: what the material is, what contaminated it, and whether it has oxidised. Those answers then guide the mechanical or thermal investigation that follows.
Compliance support. Where a standard or pharmacopoeial monograph specifies infrared identification, FTIR is the direct compliance tool [14]. Where regulation concerns records rather than chemistry, the software environment matters as much as the measurement [15].
Common Testing Challenges
Telling closely related polymers apart. HDPE and LDPE, different polyamide grades, and polyester copolymers differ in subtle intensity ratios and band splitting, rather than in which bands are present at all. Weathered material makes this harder still. Published research has documented cases where a large share of weathered polyethylene samples could not be told apart using ATR FTIR alone, without a clearly defined decision procedure.
Highly filled and black compounds. Carbon black weakens the spectrum, and high mineral loading adds strong bands on top of it and increases scattering [18].
Additives present at low levels. The working concentrations of stabilisers and process aids often fall below what FTIR can detect directly against the polymer background, so extraction or chromatography is needed instead [10].
Blends and multilayer structures. A bulk measurement of a blend produces a mix of overlapping spectra, and separating them is not always possible. Spatially resolved microspectroscopy on a cross section is the right approach for layered structures [4].
Library limitations. Libraries built on transmission spectra do not always match ATR data well without correction [17], and a library that does not contain the material cannot identify it.
Sample shape. Curved, rigid or fragile parts make good ATR contact difficult. Reflectance measured without contact is an alternative, at the cost of more complex spectral correction [18].
Instrument drift. Without periodic performance testing against the instrument's own history, gradual degradation goes unnoticed until results become inconsistent [3].
How to Select the Right Testing Approach
The following guidance is framed around the analytical question rather than around any particular instrument.
| Analytical question | Typical first choice | Supporting standard |
|---|---|---|
| What polymer is this? | ATR FTIR, library matching | ASTM E1252 [1]; ISO 4650 for rubbers [5] |
| What is this speck, or why did this film delaminate? | Infrared microspectroscopy on a cross section | ASTM D5477 [4] |
| How much of component X is present? | Transmission with a calibrated method | ASTM E168 [2]; ASTM D6248 [8]; ASTM D3900 [9] |
| How oxidised is this part? | Transmission on microtomed sections, band ratio index | ASTM F2102 [7] |
| How is this material ageing under exposure? | FTIR with UV/visible light, following a defined method | ISO 10640 [6] |
| What polymers are these particles? | Microscopy combined with vibrational spectroscopy | ISO 16094-2 [11] |
| Which stabilisers are present, and how much? | Extraction, then chromatographic analysis | ASTM D7210 and related methods [10] |
-
Decide whether you need surface information or bulk information. ATR answers surface questions, and transmission through a section answers bulk questions. Confusing the two is the most common source of misleading results.
-
Match the detector and accessory to the sample in front of you, not to the specification sheet. Cooled MCT detectors provide the sensitivity needed for microscopy and small aperture work. Detectors that run at room temperature, called pyroelectric detectors, are entirely adequate for routine bulk identification and need no cooling liquid.
-
Build the library before you need it. A library of verified reference spectra measured on your own instrument, in the sampling mode you actually use, is worth more than a large generic commercial library measured under different conditions.
-
Recognise when FTIR is the wrong tool. FTIR identifies functional groups and chemical classes. It does not directly measure molecular weight, thermal transitions, how much filler is present by weight, or trace amounts of organic compounds. Differential scanning calorimetry, thermogravimetric analysis, chromatography and mass spectrometry answer those questions instead. The best labs treat FTIR as the first step in a sequence of tests, not as a complete answer on its own.
FTIR Instrumentation: What the Specifications Mean
When evaluating an FTIR spectrometer for polymer and additive work, a few specifications carry real analytical consequences.
- Spectral range. This determines which vibrations the instrument can see. Extending the range below 400 cm⁻¹ brings inorganic filler and pigment vibrations into view, and extending it above 4000 cm⁻¹ reaches overtone and combination bands. The range depends on the combination of source, beamsplitter, detector and window materials used.
- Spectral resolution. This defines how well closely spaced bands can be separated. Higher available resolution gives useful headroom, but routine polymer work rarely needs better than 4 cm⁻¹ [16].
- Signal to noise ratio. This directly controls how weak a feature can still be told apart from noise, which matters for minor components and for microscopy work.
- Wavenumber accuracy. This governs how reliably measured band positions can be compared with reference data. It is checked against a certified reference material [12].
- Detector options. Pyroelectric detectors are rugged and need little maintenance. Versions with stabilised temperature control improve baseline stability. MCT detectors provide higher sensitivity and a faster response for demanding applications.
- Accessory compatibility. For polymer laboratories, the ability to switch between ATR, transmission, reflectance, gas and liquid cells, thermal accessories and microscopy determines how many of the applications above the instrument can actually serve.
- Software and records. In regulated environments, the software's ability to support validated, auditable electronic records is a compliance requirement in its own right [15].
Where the Testshine TS-530A fits
Among instruments built for this kind of work, the Testshine TS-530A FTIR Spectrometer is a Fourier transform infrared spectrometer built around a Cube Corner Michelson interferometer, with a multilayer Ge coated KBr beam splitter and a high intensity, long lifetime, air cooled infrared source. Its published specifications include a wavenumber range of 7800 to 350 cm⁻¹, spectral resolution of 0.85 cm⁻¹, a signal to noise ratio better than 20,000 to 1 (RMS value), and wavenumber accuracy of ±0.01 cm⁻¹ [19].
The standard detector is a high sensitivity pyroelectric detector, with a temperature stabilised pyroelectric detector and a semiconductor cooled MCT detector available as options [19]. A transmission sample holder is supplied as the standard accessory, and optional accessories include ATR, liquid cells, gas cells, diffuse and specular reflection accessories, single and multi reflection ATR, thermal accessories and a microscope [19]. The instrument runs on the MainFTOS FTIR software workstation under Windows, supports Ethernet and WiFi communication, and provides real time monitoring of temperature, humidity and self diagnostics. FDA 21 CFR Part 11 and IQ/OQ/PQ compliance are listed as optional [19].
Testshine lists polymer and plastic identification among the instrument's applications, describing identification of polymers, plastic additives, fillers and unknown materials from their characteristic infrared absorption spectra, for incoming material inspection, product verification and polymer research, alongside pharmaceutical analysis, chemical and petrochemical research, environmental testing and academic research [19].
As with any FTIR system, the accessories fitted, not the spectrometer alone, determine which of the applications described in this article a given installation can support. The specifications above are as published by the manufacturer and are given here for reference only. They are not an endorsement of comparative performance.
Conclusion
FTIR spectroscopy earns its place as the technique labs usually reach for first in polymer and additive identification, because it combines speed, minimal sample preparation and chemical specificity. A single ATR measurement can tell common polymers apart, reveal mineral fillers and plasticisers, and expose oxidation or contamination, often in less time than it takes to weigh out a sample for a thermal test.
The technique's limits are just as clear and just as important. ATR sees the surface, not the bulk. Stabilisers present at low levels usually need extraction before they become visible. Compounds filled with carbon black suppress the spectrum. Chemically similar polymers need careful interpretation rather than reliance on a match score. And quantitative work needs calibrated methods, controlled path lengths and clearly defined band ratios, not casual peak measurements [2][7][8][9].
The standards framework reflects this reality. It covers general practices for qualitative and quantitative infrared analysis [1][2], instrument performance verification [3], certified wavenumber reference materials [12], and methods written for specific applications: rubbers [5], polyolefins [8][9][10], implant polyethylene [7], photoageing [6], multilayer films and inclusions [4], and microplastics [11]. A laboratory that works within this framework, choosing the right sampling technique for the question, verifying instrument performance, building a library under the conditions it actually uses, and confirming results with complementary techniques when the stakes justify it, will get reliable, defensible information from FTIR across the full range of polymer and additive applications.
Relevant Testshine Product
Bring Reliable FTIR Material Identification to Your Polymer QC Lab with the Testshine TS-530A FTIR Spectrometer
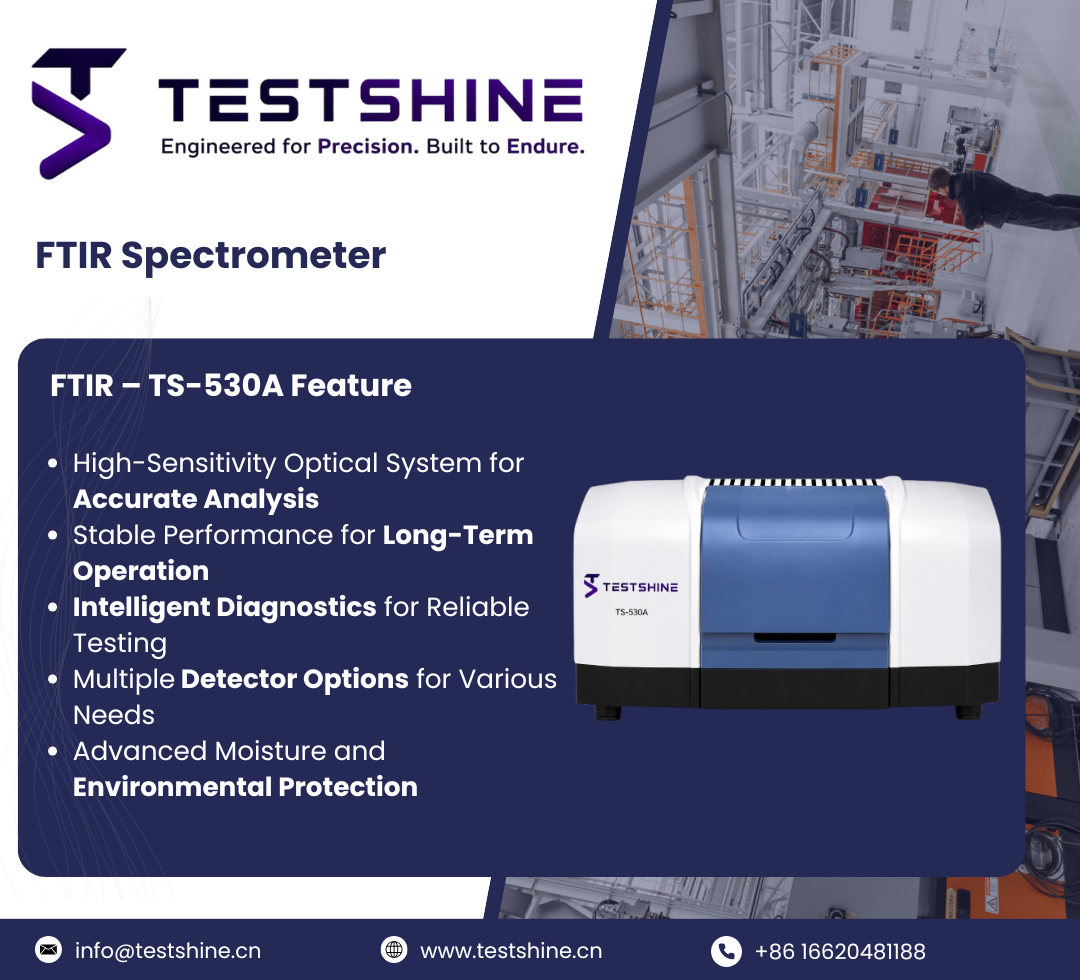
Every analysis discussed in this article, identifying a base polymer, detecting fillers and plasticisers, tracking oxidation and photoageing, and examining specks and coextruded film layers, depends on an instrument that produces stable, reproducible infrared spectra test after test. The Testshine TS-530A FTIR Spectrometer is built around that requirement.
Why it fits the polymer and additive identification process described above:
- An interferometer built for spectral stability. A Cube Corner Michelson interferometer with a multilayer Ge coated KBr beam splitter and a high intensity, long lifetime, air cooled infrared source.
- Specified measurement performance. Wavenumber range 7800 to 350 cm⁻¹, spectral resolution 0.85 cm⁻¹, signal to noise ratio better than 20,000:1 (RMS value), and wavenumber accuracy of ±0.01 cm⁻¹.
- Detector options for routine and demanding work. A high sensitivity pyroelectric detector as standard, with a temperature stabilised pyroelectric detector and a semiconductor cooled MCT detector available as options.
- One instrument, many sampling modes. A large modular sample chamber takes a transmission sample holder as the standard accessory, with optional ATR, single and multi reflection ATR, liquid cells, gas cells, diffuse and specular reflection accessories, thermal accessories and a microscope, covering the sampling techniques compared in this article.
- Data capture that feeds the laboratory. The MainFTOS FTIR software workstation, compatible with Windows, provides real time data acquisition, spectrum processing, reporting and export, with Ethernet and WiFi communication and real time monitoring of temperature, humidity and self diagnostics.
- Options for regulated laboratories. FDA 21 CFR Part 11 compliance and IQ/OQ/PQ are listed as optional.
Testshine lists polymer and plastic identification among the instrument's applications: identification of polymers, plastic additives, fillers and unknown materials from their characteristic infrared absorption spectra, for incoming material inspection, product verification and polymer research.
References
-
ASTM International, "ASTM E1252-98(2021): Standard Practice for General Techniques for Obtaining Infrared Spectra for Qualitative Analysis," ASTM International, West Conshohocken, PA, 2021. https://store.astm.org/e1252-98.html
-
ASTM International, "ASTM E168-16: Standard Practices for General Techniques of Infrared Quantitative Analysis," ASTM International, West Conshohocken, PA, 2016. https://store.astm.org/e0168-16.html
-
ASTM International, "ASTM E1421-99(2021): Standard Practice for Describing and Measuring Performance of Fourier Transform Mid-Infrared (FT-IR) Spectrometers: Level Zero and Level One Tests," ASTM International, West Conshohocken, PA, 2021. https://store.astm.org/e1421-99r21.html
-
ASTM International, "ASTM D5477-18: Standard Practice for Identification of Polymer Layers or Inclusions by Fourier Transform Infrared Microspectroscopy (FT-IR)," ASTM International, West Conshohocken, PA, 2018. https://store.astm.org/d5477-18.html
-
International Organization for Standardization, "ISO 4650:2012, Rubber, Identification, Infrared spectrometric methods," ISO, Geneva, 2012. https://www.iso.org/standard/53026.html (revision under development: ISO/DIS 4650, https://www.iso.org/standard/88777.html)
-
International Organization for Standardization, "ISO 10640:2011, Plastics, Methodology for assessing polymer photoageing by FTIR and UV/visible spectroscopy," ISO, Geneva, 2011. https://www.iso.org/standard/46024.html
-
ASTM International, "ASTM F2102-17: Standard Guide for Evaluating the Extent of Oxidation in Polyethylene Fabricated Forms Intended for Surgical Implants," ASTM International, West Conshohocken, PA, 2017. https://store.astm.org/f2102-17.html
-
ASTM International, "ASTM D6248: Standard Test Method for Vinyl and Trans Unsaturation in Polyethylene by Infrared Spectrophotometry," ASTM International, West Conshohocken, PA. https://store.astm.org/d6248-98.html
-
ASTM International, "ASTM D3900-17(2021): Standard Test Methods for Rubber, Determination of Ethylene Units in Ethylene-Propylene Copolymers (EPM) and in Ethylene-Propylene-Diene Terpolymers (EPDM) by Infrared Spectrometry," ASTM International, West Conshohocken, PA, 2021. https://store.astm.org/d3900-17r21.html
-
ASTM International, "Plastics Standards" (index listing current designations including D2238-22, D7210-21, D7083-16(2022) and D6953-18), ASTM International, West Conshohocken, PA. https://store.astm.org/products-services/standards-and-publications/standards/plastics-standards.html
-
International Organization for Standardization, "ISO 16094-2:2025, Water quality, Analysis of microplastic in water, Part 2: Vibrational spectroscopy methods for waters with low content of suspended solids including drinking water," ISO, Geneva, 2025. https://www.iso.org/standard/84460.html
-
National Institute of Standards and Technology, "Certificate of Analysis, SRM 1921b: Infrared Transmission Wavelength/Wavenumber Standard," NIST, U.S. Department of Commerce, issue date 17 September 2025. https://tsapps.nist.gov/srmext/certificates/1921B.pdf
-
United States Pharmacopeia, "General Chapter <197> Spectroscopic Identification Tests," USP NF. https://doi.usp.org/USPNF/USPNF_M98947_05_01.html
-
U.S. Food and Drug Administration, "21 CFR Part 11: Electronic Records; Electronic Signatures," Electronic Code of Federal Regulations. https://www.ecfr.gov/current/title-21/chapter-I/subchapter-A/part-11
-
S. T. Nicolau and A. J. Matzger, "An evaluation of resolution, accuracy, and precision in FT-IR spectroscopy," Spectrochimica Acta Part A: Molecular and Biomolecular Spectroscopy, vol. 319, article 124545, 2024. https://www.sciencedirect.com/science/article/abs/pii/S138614252400711X
-
E. V. Miseo and P. J. Larkin, "Fourier Transform Infrared Spectroscopy (FT-IR) Diamond Attenuated Total Reflection (ATR) Measurements: The Good, the Bad, and the (Really) Ugly," SAGE Journals, 2025. https://journals.sagepub.com/doi/10.1177/27551857251336262
-
J. Bell et al., "Non-invasive identification of polymers in cultural heritage collections: evaluation, optimisation and application of portable FTIR (ATR and external reflectance) spectroscopy to three-dimensional polymer-based objects," Heritage Science, vol. 7, article 95, 2019. https://www.nature.com/articles/s40494-019-0336-0
-
Testshine, "FTIR Spectrometer: TS-530A," product page, Testshine Co., Ltd. https://testshine.cn/products/analytical-instruments/ts-530a/