Fourier Transform Infrared Spectroscopy (FTIR): Principles, Instrumentation, and Applications
1. Introduction
Chemists and quality professionals have leaned on infrared analysis for close to a century, and few instruments in that toolkit have proven as adaptable as Fourier Transform Infrared, or FTIR, spectroscopy. Instead of measuring one wavelength of infrared light at a time, an FTIR instrument captures every wavelength in a single pass, condenses the acquisition into a matter of seconds, and reconstructs a detailed absorption spectrum through a mathematical operation known as the Fourier transform.
The resulting spectrum behaves much like a chemical fingerprint. Two substances built from different combinations of atoms will almost never produce the same pattern of absorption bands, and that is precisely why FTIR has become a default method for confirming what a material is, how consistent it remains from batch to batch, and how much of a given component sits within a mixture.
No two molecular structures generate an identical infrared spectrum, which is exactly what makes FTIR such a dependable identification tool.
This guide walks through the reasoning behind FTIR, the mechanics of the interferometer at its core, the journey a sample takes through the instrument step by step, and the practical advantages that have made the technique a standard choice across pharmaceuticals, polymers, forensics, environmental testing, and many other fields.
Whether the goal is confirming a raw material before it enters production, tracking down an unexpected contaminant, or building a quantitative method for routine batch testing, the same underlying principles apply. Understanding those principles, rather than treating the instrument as a black box, makes it far easier to troubleshoot unusual results, choose the right sampling accessory, and get the most from the technology already sitting on the bench.
2. What Is FTIR Spectroscopy?
In an infrared spectroscopy experiment, a beam of infrared radiation is directed through or onto a sample. Depending on the sample's molecular structure, certain frequencies of that radiation are absorbed while the rest pass through or reflect back. Plotting the amount of radiation absorbed against frequency produces the sample's infrared spectrum, effectively a molecular fingerprint unique to that substance.
FTIR spectroscopy delivers three broad categories of information that make it valuable across a wide range of laboratory settings:
- Identification of unknown materials, achieved by comparing a measured spectrum against reference libraries
- Assessment of sample quality and batch to batch consistency
- Quantification of individual components within a mixture
Because the technique is fast, requires minimal sample preparation, and is largely nondestructive, it has become a routine first step in materials characterization, often the very first test run when an unknown sample lands on a bench.
3. Why Infrared Spectroscopy Remains a Workhorse Technique
Infrared spectroscopy has served as a foundational materials analysis method in laboratories for more than seventy years. Every absorption peak in an infrared spectrum corresponds to a specific vibrational motion between the bonds that hold a molecule's atoms together, including stretching, bending, twisting, and scissoring motions that occur at characteristic, predictable frequencies.
Since every compound is built from a distinct arrangement of atoms and bonds, no two chemically different substances generate an identical spectrum. This gives infrared spectroscopy the ability to deliver a positive, qualitative identification for virtually any kind of material. Just as importantly, the height and area of each absorption peak scale directly with the amount of the corresponding substance present in the sample. Paired with modern computational algorithms, this relationship turns infrared spectroscopy into a dependable tool for quantitative analysis as well as identification.
4. The Predecessor: Dispersive Infrared Instruments
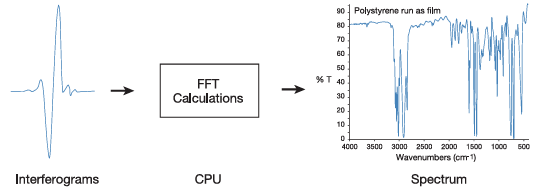
Before Fourier transform methods became standard, infrared instruments used a dispersive design. These systems physically separated the individual frequencies emitted by the infrared source using a prism or a diffraction grating, the same principle by which a glass prism splits visible light into a rainbow of colors. Gratings, a later refinement, offered better separation of infrared frequencies than prisms.
In a dispersive instrument, a detector measured the intensity of radiation at each frequency individually, after it had passed through the sample, and the resulting plot of intensity against frequency formed the spectrum. Because each frequency had to be scanned in sequence, building a complete spectrum was a slow process, often taking several minutes per sample.
Fourier transform infrared spectroscopy was developed specifically to overcome this bottleneck, and it is now favored over dispersive and filter based methods for several concrete reasons:
- It is a nondestructive technique
- It offers a precise measurement approach that requires no external calibration standard
- It dramatically increases throughput, capable of collecting a full scan roughly every second
- It boosts sensitivity, since multiple one second scans can be co added to average out random noise
- It delivers greater optical throughput than dispersive designs
- It is mechanically simple, containing only a single moving part
5. The FTIR Breakthrough: Inside the Interferometer
The central innovation behind FTIR is a deceptively simple optical device called an interferometer, most commonly built around a Michelson configuration. Its job is to measure every infrared frequency simultaneously rather than one at a time, cutting acquisition time from several minutes down to roughly a second.
At the heart of the interferometer sits a beamsplitter, which divides the incoming infrared beam into two separate paths. One beam reflects off a mirror that remains fixed in position. The other reflects off a mirror mounted on a mechanism that lets it travel a very short distance, typically just a few millimeters, toward and away from the beamsplitter. After bouncing off their respective mirrors, both beams return to the beamsplitter and recombine.
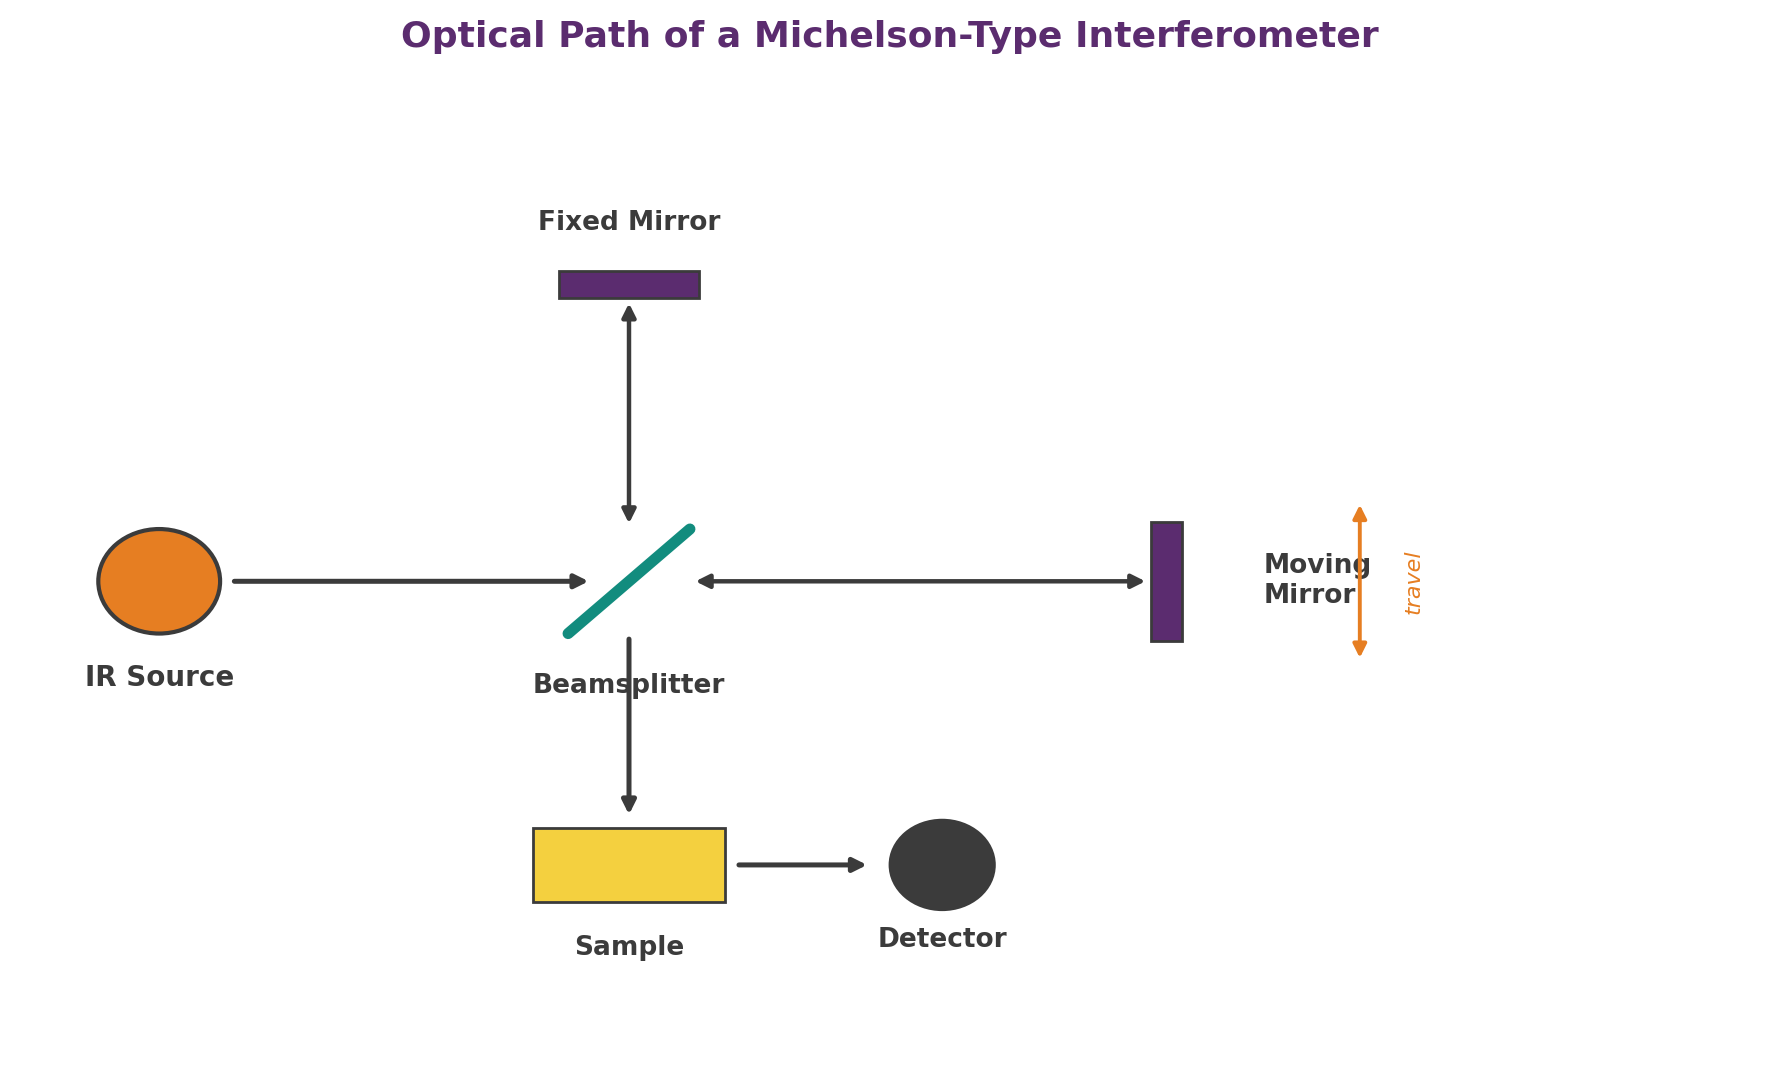
Figure 1. A Michelson type interferometer splits the beam, reflects it off a fixed and a moving mirror, then recombines the two paths before they reach the sample.
Because the fixed mirror path always covers the same distance while the moving mirror path constantly changes, the recombined beam is the product of the two paths interfering with one another, reinforcing at some frequencies and canceling at others as the mirror moves. The resulting signal, called an interferogram, has a remarkable property: every single data point within it, tied to a specific mirror position, carries information about every infrared frequency emitted by the source, all superimposed at once.
In practical terms, this means the entire infrared spectrum is being measured continuously and simultaneously for as long as the interferogram is being recorded. That is the source of FTIR's dramatic speed advantage over dispersive scanning.
6. From Interferogram to Spectrum: The Fourier Transform
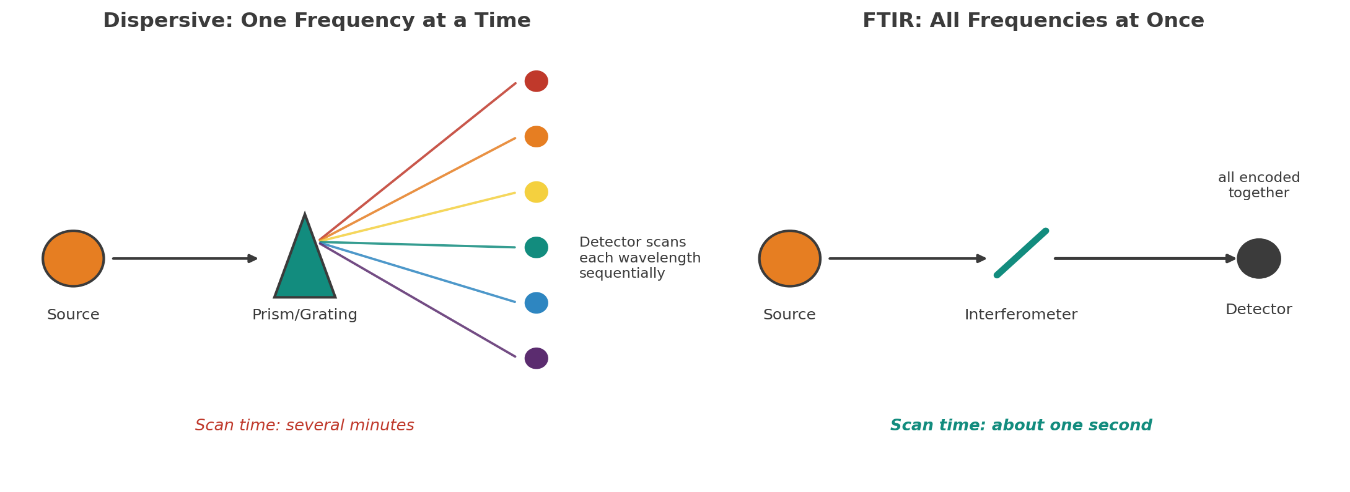
An interferogram on its own is not directly useful to an analyst. What is needed is a conventional spectrum showing intensity at each individual frequency, since that is the form in which absorption bands can be identified and interpreted. Converting the raw interferogram into that familiar frequency domain spectrum requires a well established mathematical operation known as the Fourier transformation.
This transformation is carried out by the instrument's computer immediately after data collection, decoding the superimposed frequency information hidden inside the interferogram and presenting the analyst with a conventional spectral plot, intensity, typically expressed as percent transmittance, plotted against wavenumber, ready for interpretation.
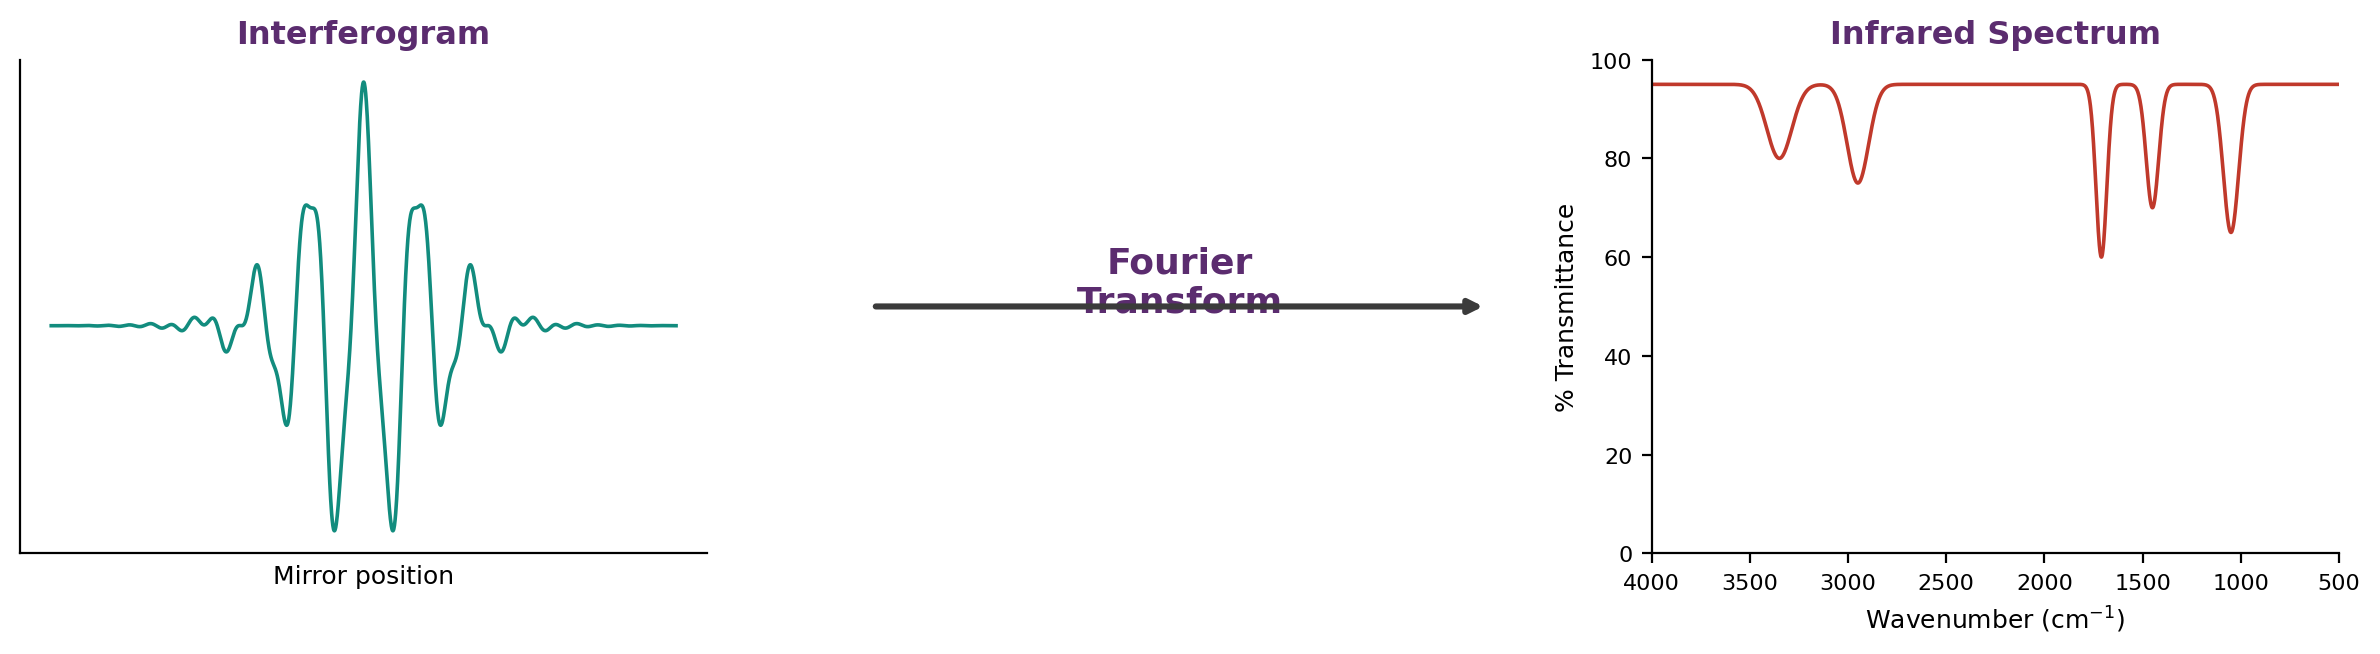
Figure 2. The raw interferogram (left) is mathematically converted by the Fourier transform (center) into a conventional infrared spectrum (right), typically displayed from 4000 to 500 reciprocal centimeters.
7. The Five Stage Analytical Workflow
Every FTIR measurement, regardless of the sample or instrument model, follows the same underlying sequence of five stages:
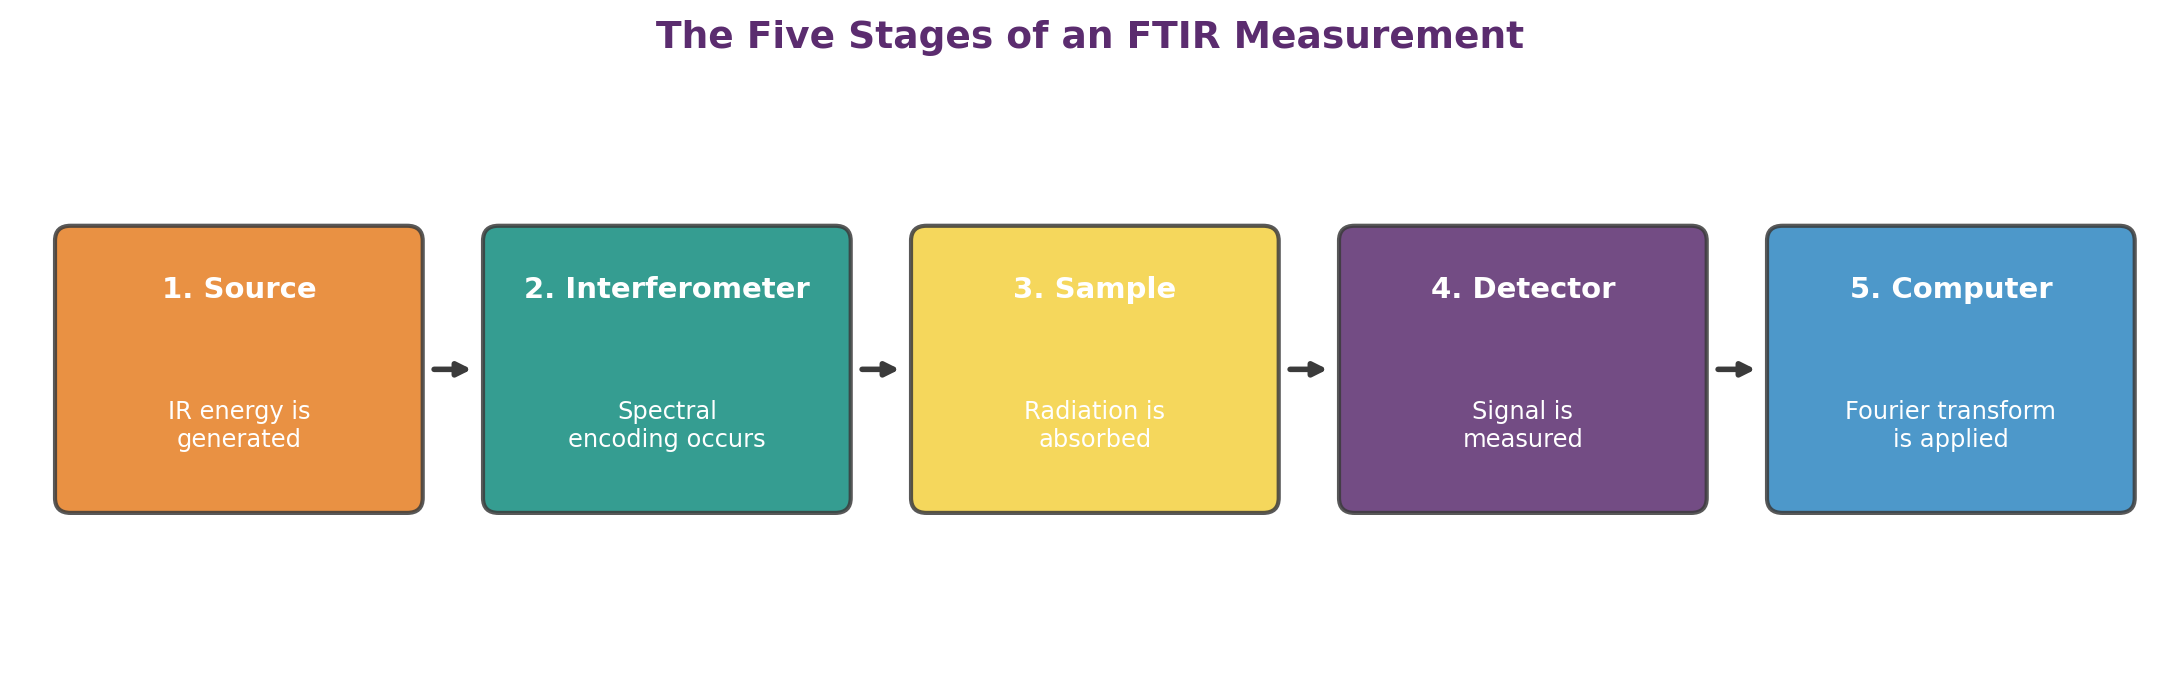
Figure 3. The five stages of an FTIR measurement, from source to computed spectrum.
1. The Source
Infrared energy originates from a glowing black body source. Before reaching the sample and, eventually, the detector, the beam passes through an aperture that controls how much energy is admitted into the system.
2. The Interferometer
The beam enters the interferometer, where the spectral encoding described in Section 5 takes place. A reference helium neon laser inside the interferometer provides precise wavelength calibration, tracks the moving mirror's exact position, and times the data acquisition process. The resulting interferogram then exits toward the sample compartment.
3. The Sample
The encoded beam enters the sample compartment, where it is either transmitted through the sample or reflected from its surface, depending on the sampling technique being used. This is the point at which specific frequencies, those uniquely characteristic of the sample's chemical bonds, are absorbed.
4. The Detector
The beam finally reaches a detector purpose built to measure the unusual, rapidly oscillating interferogram signal rather than a simple steady state intensity.
5. The Computer
The detector's output is digitized and passed to the instrument's computer, where the Fourier transformation is performed. The finished infrared spectrum is then displayed for the analyst to interpret, annotate, or process further.
8. Establishing the Baseline: The Role of Background Spectra
Absorption intensity only carries meaning relative to a baseline, so every FTIR workflow includes a background measurement, a scan collected with no sample in the beam path. Comparing a sample scan against this background allows the software to calculate percent transmittance, effectively subtracting out every characteristic of the instrument itself, from the source and optics to the detector response.
What remains is a spectrum whose features are attributable strictly to the sample. Because the background spectrum reflects the instrument rather than any particular sample, a single background measurement can be reused across many subsequent sample scans, streamlining routine analysis without sacrificing accuracy.
9. Why FTIR Outperforms Dispersive Methods
The shift from dispersive to Fourier transform infrared instrumentation was not incremental. It represented a fundamental change in how infrared data is collected, and it delivered advantages that are now taken for granted in modern laboratories.
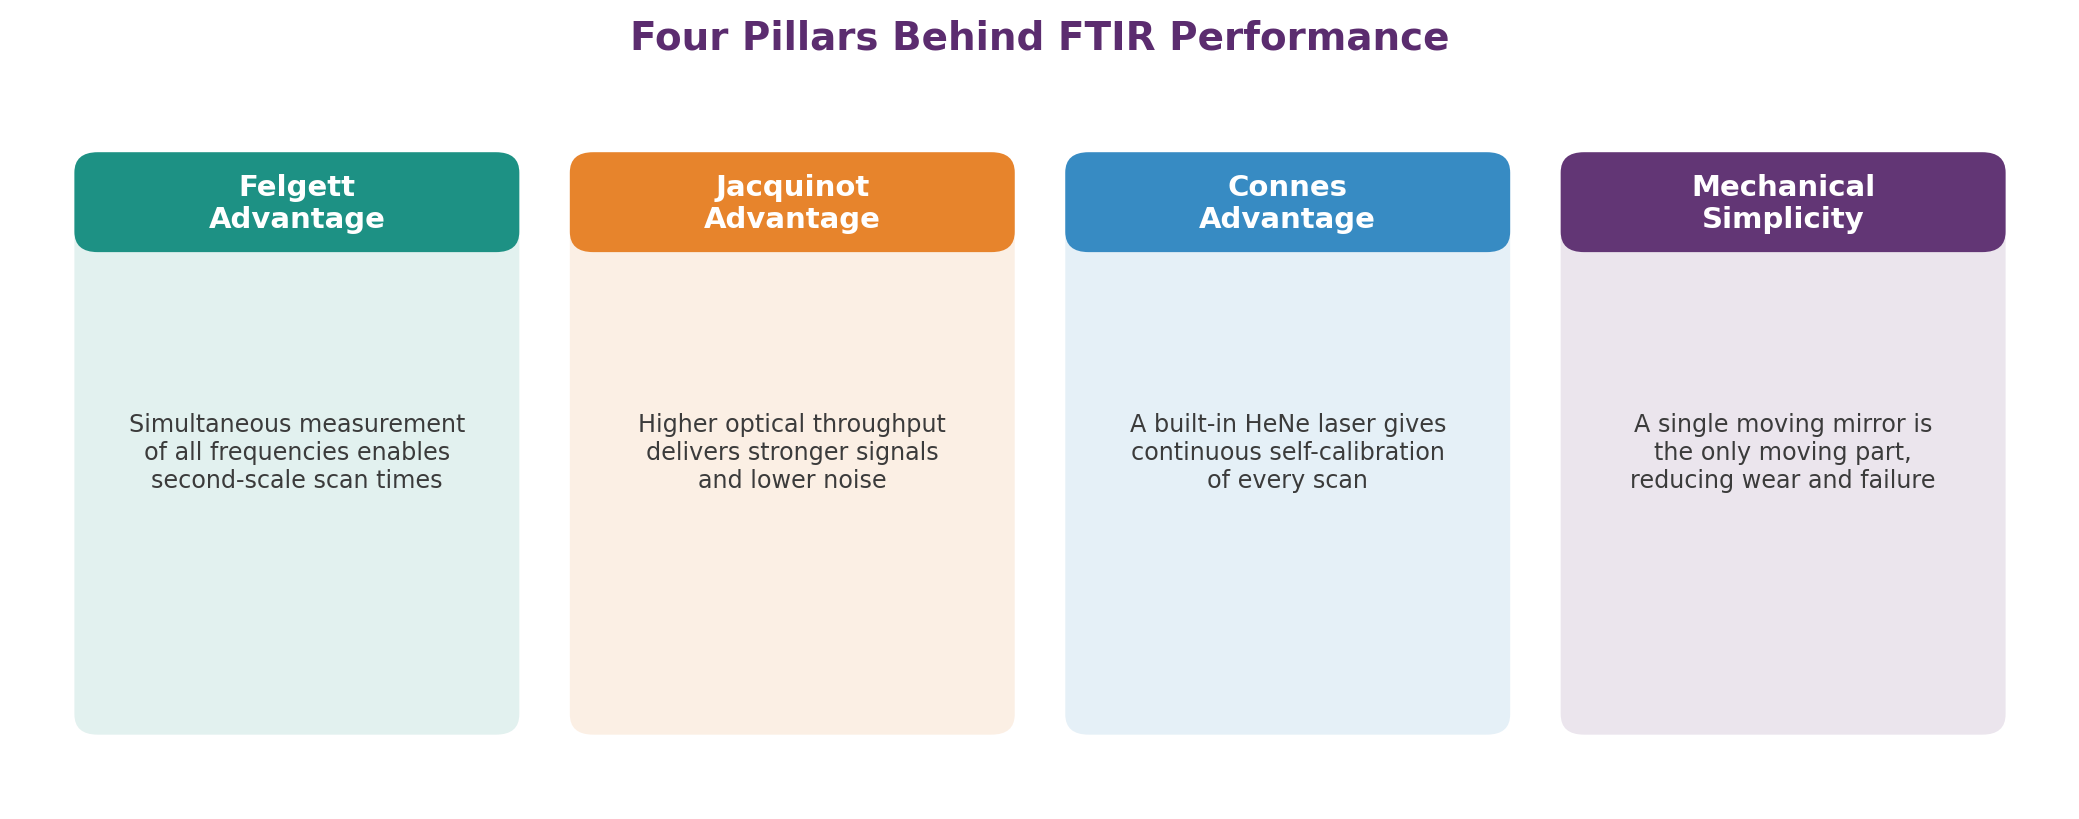
Figure 4. Four performance advantages that distinguish FTIR from earlier dispersive instrumentation.
Speed: The Felgett Advantage
Because every frequency is captured simultaneously rather than sequentially, most FTIR measurements are completed in a matter of seconds instead of the several minutes a dispersive scan required. This throughput gain is commonly referred to as the Felgett Advantage.
Sensitivity: The Jacquinot Advantage
FTIR sensitivity benefits from several compounding factors: detectors that are inherently more sensitive, an optical design with substantially higher throughput, known as the Jacquinot Advantage, which lowers overall noise, and scan speeds fast enough that multiple scans can be co added together. That co addition, or signal averaging, reduces random measurement noise to whatever level the analysis demands.
Mechanical Simplicity
The moving mirror inside the interferometer is the only continuously moving component in the entire instrument. With so few moving parts, the risk of mechanical failure drops considerably compared with the multi part scanning mechanisms of dispersive designs.
Built In Calibration: The Connes Advantage
Modern FTIR instruments use a helium neon reference laser as an internal wavelength calibration standard, an approach known as the Connes Advantage. This makes the instruments self calibrating, so users never need to perform manual wavelength calibration.
Together, these characteristics make FTIR measurements exceptionally accurate and reproducible, supporting confident, positive identification of virtually any sample type. The technique's sensitivity is sharp enough to flag even trace level contaminants, which is why FTIR has become indispensable for quality control and quality assurance work, whether comparing production batches against a reference standard or tracking down an unexpected contaminant. Combined with a growing library of quantitative software algorithms, FTIR has also become a practical, everyday tool for quantitative analysis, with methods that are straightforward to develop, calibrate, and roll into routine testing procedures.
At a Glance: Dispersive vs. Fourier Transform Infrared
| Characteristic | Dispersive Infrared | FTIR |
|---|---|---|
| Frequency measurement | One frequency at a time | All frequencies simultaneously |
| Typical scan time | Several minutes | About one second |
| Calibration | External calibration required | Self calibrating (Connes Advantage) |
| Moving parts | Multiple scanning components | Single moving mirror |
| Noise reduction | Limited | Signal averaging via scan co addition |
| Optical throughput | Lower | Higher (Jacquinot Advantage) |
10. Common Sampling Techniques
A large part of FTIR's practical value comes from the variety of ways a sample can be presented to the beam. Choosing the right sampling technique is often the difference between a clean, interpretable spectrum and a noisy or distorted one, and modern accessories have made most of these techniques fast and largely nondestructive.
Transmission
The classic approach, transmission analysis passes the infrared beam directly through a thin film, a liquid held between salt plates, or a solid pressed into a pellet. It remains a reliable choice whenever a sample can be prepared thin enough for the beam to pass through without excessive absorption.
Attenuated Total Reflectance (ATR)
ATR has become the default technique for many laboratories because it requires little to no sample preparation. The sample is simply pressed against a crystal of high refractive index, and the beam samples only the top few micrometers of material in contact with the crystal, ideal for powders, pastes, fibers, and other materials that are difficult to prepare as thin films.
Diffuse and Specular Reflectance
Reflectance techniques collect infrared energy that scatters or reflects off a sample's surface rather than passing through it, making them well suited to rough powders, coatings, and surface films where transmission sampling is impractical.
Micro Sampling with Infrared Microscopes
When only a tiny fragment of material is available, a single fiber, a paint chip, or a small inclusion in a larger matrix, an infrared microscope can focus the beam onto an area as small as a few tens of micrometers, extending FTIR's reach to forensic and failure analysis samples that would otherwise be too small to test.
11. Reading an FTIR Spectrum
An infrared spectrum is typically displayed with wavenumber, expressed in reciprocal centimeters, decreasing from left to right along the x axis, and percent transmittance or absorbance on the y axis. Analysts generally divide the spectrum into two broad regions that make interpretation more manageable.
The Functional Group Region (roughly 4000 to 1500 reciprocal centimeters)
Peaks in this higher frequency region tend to correspond to the stretching vibrations of specific chemical bonds, such as O to H, N to H, C to H, and C to O groups, making this region especially useful for spotting the presence or absence of particular functional groups.
The Fingerprint Region (roughly 1500 to 500 reciprocal centimeters)
This lower frequency region is typically dense with overlapping bending and skeletal vibrations that are highly specific to a molecule's overall structure. While individual peaks here are harder to assign to a single bond type, the region as a whole acts as a distinctive signature, much like a fingerprint, that can be matched against reference libraries for confident identification.
In practice, most identification workflows lean on searchable spectral libraries and matching algorithms rather than manual peak by peak assignment, but a working knowledge of these two regions remains useful for sanity checking a library match or troubleshooting an unexpected result.
12. Best Practices for Reliable FTIR Results
Even with an instrument that self calibrates and requires minimal setup, a handful of habits separate consistently reliable FTIR results from occasionally puzzling ones:
- Collect a fresh background scan whenever ambient conditions change, such as humidity or carbon dioxide levels in the room
- Match the sampling accessory to the physical form of the sample rather than forcing every material through the same technique
- Keep ATR crystals and sample windows clean and free of residue between measurements to avoid cross contamination
- Co add enough scans to reach an acceptable noise floor, especially for trace level quantitative work
- Maintain a well organized spectral library so unknown material matches remain fast and dependable over time
- Document instrument parameters, such as resolution and number of scans, alongside every result for traceability
None of these steps require specialized expertise, but together they help ensure that the spectra produced today remain directly comparable to those collected months or years from now, a critical requirement for long term quality control programs.
13. Real World Applications of FTIR
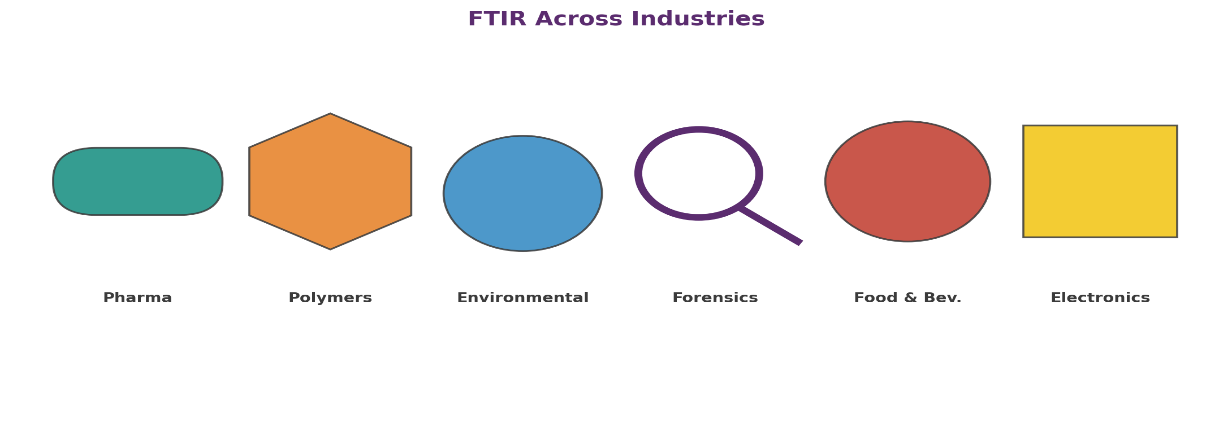
The combination of speed, sensitivity, and reliable self calibration has pushed FTIR far beyond the research laboratory and into everyday industrial and regulatory workflows. Typical applications include the following:
- Confirming the identity of incoming raw materials before they enter production
- Verifying batch to batch consistency of finished products against a quality standard
- Detecting and identifying unknown contaminants in a formulation or process stream
- Quantifying the concentration of individual components within a complex mixture
- Supporting failure analysis and forensic investigations through material identification
- Screening polymers, coatings, fibers, and powders as part of routine quality assurance
Because sampling accessories now allow measurements on materials as small as tens of micrometers, including fibers, pellets, films, and powders, FTIR has become adaptable enough to serve nearly any sample format a laboratory is likely to encounter.
Industry Spotlight
| Industry | Typical Use of FTIR |
|---|---|
| Pharmaceuticals | Raw material verification, polymorph screening, and release testing of active ingredients |
| Polymers and plastics | Resin identification, additive analysis, and detection of counterfeit or substituted materials |
| Environmental testing | Screening for contaminants in soil, water, and air filter samples |
| Forensics | Identifying trace evidence such as fibers, paints, and unknown residues |
| Food and beverage | Verifying ingredient authenticity and detecting adulteration in raw materials |
| Semiconductors and electronics | Assessing coatings, contamination, and thin film composition on components |
14. Instrument Families: Matching Technology to the Task
Not every laboratory has the same throughput, budget, or regulatory requirements, which is why FTIR instrumentation today spans a range of configurations, from compact benchtop units built for routine identification to high resolution research grade systems and dedicated infrared microscopes for micro sampling work.
| Instrument Category | Typical Strength |
|---|---|
| Research grade benchtop systems | Upgradeable configurations, high resolution, and broad spectral range for demanding or evolving applications |
| Regulatory and QC focused systems | Built in compliance and performance verification tools suited to pass or fail testing and audit readiness |
| Compact benchtop systems | Simplified sampling, setup, and interface for fast, routine identification work |
| Infrared microscopes | Automated micro sampling and imaging for extremely small sample areas |
| Sample compartment accessories | Attenuated total reflectance and other add ons enabling measurement of fibers, pellets, films, and powders down to roughly 50 micrometers |
Selecting the right configuration typically comes down to matching the instrument's resolution, throughput, and accessory options to the sample types and regulatory demands a laboratory actually faces day to day.
14b. Emerging Trends in FTIR Technology
FTIR is a mature technique, but it is far from a static one. Several developments continue to expand what the technology can practically deliver in a working laboratory:
- Portable and handheld FTIR units are bringing lab grade identification into the field, from raw material receiving docks to environmental spill response
- Tighter integration with chemometric and machine learning software is speeding up complex quantitative modeling that once required specialist expertise
- Cloud connected spectral libraries allow instruments across multiple sites to share reference data and stay aligned on identification criteria
- Higher throughput automation, including autosamplers and robotic sample handling, is turning FTIR into a higher volume screening tool rather than a one sample at a time technique
As these capabilities mature, FTIR is likely to keep pushing further into process monitoring and in line quality roles, supplementing its traditional position as an at line or laboratory based confirmatory test.
15. Conclusion
Fourier transform infrared spectroscopy solved the central limitation of older dispersive instruments, slow, sequential frequency scanning, by measuring every infrared frequency at once and mathematically decoding the result. The outcome is a technique that is fast, sensitive, mechanically simple, and inherently self calibrating, all without sacrificing the qualitative and quantitative power that has made infrared spectroscopy a laboratory staple for decades.
From confirming raw material identity to catching trace contamination and supporting rigorous quantitative methods, FTIR has proven itself adaptable to nearly any materials analysis challenge. As sampling accessories and software continue to evolve, the range of problems infrared analysis can practically address keeps expanding, making FTIR not just a long standing workhorse, but a continually advancing one.
For teams evaluating or expanding their infrared capabilities, the practical takeaway is straightforward: match the sampling technique to the sample at hand, lean on the instrument's built in calibration and signal averaging strengths, and treat the resulting spectrum as what it truly is, a detailed, reliable fingerprint of exactly what a material is made of.