FTIR for Material Verification in Plastic Manufacturing
Introduction
A plastics plant relies on the resin in the hopper being the resin the drawing asks for. A lot sold as polyethylene that is really a different type of polymer, a stream of ground up scrap mixed with a second plastic, or a part that has aged and oxidized in service can each lead to rejected parts, failures in the field or a compliance problem. Fourier transform infrared (FTIR) spectroscopy is one of the most common laboratory ways to check a material's identity quickly. It works because every plastic absorbs infrared light in its own recognizable pattern [12][13].
FTIR is used wherever plastics are made, mixed, molded, extruded, recycled or investigated after a failure. It covers common materials such as polyethylene, polypropylene, polystyrene, PVC, polyesters, nylons, rubbers, adhesives and resins. The people who use it include incoming inspection labs, quality control teams, product developers and failure analysts.
This article explains how FTIR works, how it is used to verify materials, which sampling methods and standards matter, and what can go wrong. It then shows how the specifications of one laboratory instrument relate to those needs.
Understanding FTIR Spectroscopy
The basic principle
The bonds between atoms in a molecule vibrate at set frequencies. When infrared light passes through a sample or bounces off it, each bond absorbs the light that matches its own vibration. The resulting absorption pattern, called a spectrum, works like a chemical fingerprint [12][13]. A spectrum is drawn against wavenumber, a unit written as cm⁻¹ that counts how many light waves fit in one centimeter. Most plastic identification uses the mid infrared region, which runs from about 4000 to 400 cm⁻¹. The standard ASTM E1252 covers methods for collecting spectra used to identify liquid, solid and vapor samples from 4000 to 50 cm⁻¹ [1].
What the name "Fourier transform" means
An FTIR instrument does not measure one color of infrared light at a time. Inside it, a device called an interferometer splits the beam and recombines it so that every frequency is measured together. A mathematical step, the Fourier transform, then converts that raw signal into the final spectrum [12]. Measuring everything at once makes the test fast and gives a cleaner signal than older instruments that scanned one frequency at a time.
What a spectrum tells you about a plastic
A plastic's spectrum reflects the small unit that repeats along its chains and the groups of atoms attached to it. This lets an analyst tell plastic families apart, spot the second ingredient in a copolymer (a plastic made from two kinds of building blocks), and notice new groups that form when a material oxidizes. FTIR does not directly measure molecular weight or mechanical strength, and it gives only indirect clues about how orderly the chains are packed (crystallinity), so it is usually paired with other tests when those properties matter [13].
Why Material Verification Matters in Plastic Manufacturing
Plastics are named and specified by their chemistry. The standard ISO 1043 Part 1 sets the short names for basic polymers so that one plastic does not carry several abbreviations and one abbreviation does not mean several plastics [7]. A verification test checks that the specification and the delivered material agree. FTIR helps in several ways:
- Incoming inspection. Confirm that a resin lot matches the purchase order before it enters production.
- Mix ups and contamination. Find a foreign plastic in a shipment, in ground up scrap or in scrap from layered films.
- Process and product checks. Compare a molded part or film with a spectrum from a known good sample.
- Failure analysis. Look for oxidation, contamination or an unexpected material in a part that failed.
- Records. A saved spectrum gives a traceable record that the check was done.
Testshine's product information lists plastics, rubber, adhesives, asphalt and resins among the polymer materials its TS-20 FTIR Spectrometer is used to test, along with food and drug packaging materials [15].
Sampling Techniques for Plastics
How the sample meets the infrared beam often matters more than the instrument itself. Three approaches cover most plastics work.
| Technique | How it works | Typical use for plastics |
|---|---|---|
| Transmission | The infrared beam passes through a thin film or a pressed sample. To measure amounts, the thickness must be known or corrected for [4][5]. | Films, films pressed from pellets, and work that measures composition |
| Attenuated total reflectance (ATR) | The sample is pressed against a small crystal and the beam reads the surface layer. Little or no preparation is needed [11]. | Pellets, molded parts and larger fragments for fast identification |
| Microsampling and microscopy | Spectra are collected from very small areas or particles. | Tiny contaminants and inclusions (needs a microscope accessory) |
Transmission
Transmission is the classic method, and it follows a simple rule: the more of a substance the beam passes through, the more light is absorbed. That is why it is the usual route when you need to measure amounts [2][12]. Its main drawback is sample preparation, because the sample must be thin enough for light to pass through. ASTM D5576, for example, notes that measuring amounts requires an estimate of sample thickness, made either inside the spectrum or by a separate measurement [4].
Attenuated total reflectance
ATR is popular for plastics because many materials need no preparation at all. A review of microplastic analysis calls ATR the most cost efficient option for larger particles, while warning that the pressure applied can damage particles [11]. In a validation study on plastic debris, ATR identified consumer plastics with resin codes 1 to 6 and several code 7 plastics. Cleaning the surface mattered, and wiping with water or cutting the piece worked best before analysis [8].
ATR reads only the surface, so a coating, additive that has migrated out, or a weathered outer skin can dominate the spectrum. For verification, analysts often compare a freshly cut surface with the outer surface.
Note on accessories. The TS-20 product page does not list ATR or other sampling accessories [15]. Please confirm with Testshine which accessories are available for a given configuration. Where no ATR accessory is available, transmission on a thin or pressed film, described above, remains the classic route for identifying a plastic.
Reading Plastic Spectra: Key Features
Identification depends on the pattern of several bands, not on a single peak. The table lists approximate features that analysts commonly use for common plastics. Exact positions shift a little with grade, crystallinity, additives and sampling method, so these values guide interpretation but do not replace comparison with a reference spectrum [13].
| Polymer | Commonly used features (approximate) | Comment |
|---|---|---|
| Polyethylene (PE) | Stretching of carbon hydrogen bonds (CH₂) near 2900 cm⁻¹; rocking motion of CH₂ near 720 cm⁻¹ [10] | Few strong bands; different PE grades look very similar [8] |
| Polypropylene (PP) | Methyl group (CH₃) bending near 1375 cm⁻¹, in addition to the CH₂ and CH₃ stretching bands | The methyl band tells PP apart from PE |
| Polystyrene (PS) | Aromatic ring bands near 700 and 750 cm⁻¹ | Signature of the benzene type ring |
| PVC | Carbon chlorine bond stretching in the lower, fingerprint part of the range | Added plasticizers (softening agents) bring extra bands of their own |
| PET | Carbon oxygen double bond of the ester group near 1715 cm⁻¹, and strong carbon oxygen bands | This double bond is part of the plastic's own repeating unit |
| Polyamides (nylons) | Amide bands near 1640 and 1540 cm⁻¹; nitrogen hydrogen stretching near 3300 cm⁻¹ | Moisture affects the broad region where oxygen hydrogen and nitrogen hydrogen bands appear |
These wavenumber values are textbook approximations. Always confirm them against a reference spectrum measured with the same sampling accessory.
Identity Verification Workflow
A practical routine for confirming a plastic's identity looks like this:
-
Define the expected material. Use the purchase specification, datasheet or drawing, and name the polymer with its standard abbreviation [7].
-
Check the instrument. Confirm that routine performance checks are within their limits (see the instrument section below) [3].
-
Prepare the sample. Choose a representative piece, clean the surface where needed, and pick transmission or ATR [1][8].
-
Measure the blank, then the sample. Record a background reading with nothing in the beam, then measure the sample. Use the same resolution and scan settings every time.
-
Compare. If you know what the material should be, compare its spectrum directly with a reference spectrum of the specified grade. If it is unknown, search a spectral library [15].
-
Judge the match. Look at the key bands, not only at the match score the software gives. Watch for extra bands that point to additives, contamination or aging.
-
Record the result. Save the spectrum, the method settings, the sample identity and the decision.
The Testshine product page describes both routes. When the sample can be predicted, its spectrum is compared with a standard infrared spectrum. When it cannot, the software searches an infrared spectrum library, with approximately 220,000 Sadtler spectra available through the manufacturer [15]. Free public reference spectra also exist, including the evaluated infrared spectra from the Coblentz Society hosted by NIST [14]. Libraries built for special purposes, such as microplastics work, match spectra by correlation or similar statistical methods [11].
Measuring Amounts and Condition
Measuring composition with a calibration curve
To measure how much of a substance is present, analysts relate the absorbance, or the area of a peak, at a characteristic band to concentration. They do this with a calibration curve built from samples of known content. The idea behind it is that the more of a substance there is, the more light it absorbs [2][15]. ASTM E168 describes general techniques for measuring amounts by infrared, including computer based and manual approaches [2]. Two published methods show how this works for plastics:
- ASTM D5594 measures the vinyl acetate content of ethylene vinyl acetate (EVA) copolymers on pressed films or molded plaques, with a correction for thickness. It applies to resins with about 0.5% to 55% vinyl acetate. It excludes resins that contain talc and have less than 5% vinyl acetate, because talc interferes with the band used for the measurement [5].
- ASTM D5576 describes infrared procedures for the structure of polyolefins (such as polyethylene and polypropylene) and their copolymers, mainly the types and number of branches on the chains. It notes that the techniques can be adapted for some other polymers [4].
Testshine lists ethylene content in polypropylene and polyethylene, and vinyl acetate content in EVA, among the amounts its TS-20 instrument can measure [15]. The page does not say that the instrument is validated to the ASTM methods above.
Oxidation and aging
Oxidation creates carbonyl groups, which are carbon atoms double bonded to oxygen, and these absorb infrared light. ASTM F2102 takes the carbonyl band near 1720 cm⁻¹ and divides it by a carbon hydrogen band near 1370 cm⁻¹, which cancels out the effect of thickness, to estimate oxidation in polyethylene used for surgical implants (the standard covers high density and ultra high molecular weight grades). It does not measure other forms of chemically bound oxygen [6]. Outside that medical setting the calculation is less standardized. A 2020 study found that commonly used carbonyl index methods for polyethylene and polypropylene were unreliable and could miss meaningful changes during accelerated aging, and it proposed measuring the area under a specified band range instead [9]. When you report a carbonyl index, state which bands, which baseline (the reference line the peak is measured from) and which scaling you used.
| Question | FTIR approach | Key caution |
|---|---|---|
| Is it the right polymer? | Compare with a reference or library spectrum | Similar grades, such as high density and low density polyethylene, are hard to separate [8] |
| How much of the second ingredient is present? | Calibrated absorbance or band ratio method [2][5] | Thickness and interfering fillers [4][5] |
| Has it oxidized? | Carbonyl band compared with a reference band [6][9] | The choice of method changes the result [9] |
| Is there a contaminant? | Look for extra bands and subtract a reference spectrum | Very small amounts may fall below the detection limit |
Instrument Performance Checks
A verification is only as reliable as the instrument behind it. ASTM E1421 describes two levels of tests, called Level Zero and Level One, for measuring the performance of laboratory mid infrared FTIR instruments that use a standard transmission sample holder. It does not directly cover instruments with specialized sampling accessories, near infrared instruments or step scan operation [3]. Laboratories commonly compare these specifications:
| Parameter | What it describes | Why it matters for plastics |
|---|---|---|
| Spectral range | The span of wavenumbers the instrument records | Must cover the mid infrared range, including the lower part where many identifying bands sit |
| Resolution | How well the instrument separates bands that sit close together | Routine plastic identification often needs only moderate resolution; finer settings take longer to scan |
| Signal to noise ratio | How clearly the real signal stands out from background noise, under stated conditions | Decides how well weak bands from additives or contaminants can be seen; compare values only when the conditions match |
| Wavenumber accuracy | How closely measured band positions agree with the true positions | Supports reliable library matching and correct naming of bands |
Factors Affecting FTIR Results
- Sample thickness and contact. Thickness changes absorbance in transmission [4][5]. In ATR, contact pressure and surface condition matter, and too much pressure can damage particles [11].
- Surface versus inside. ATR reads the surface layer, so coatings, contamination or weathering can mislead.
- Cleaning. The way a surface is cleaned affected identification success in work on plastic debris [8].
- Fillers and additives. Talc, for example, interferes with the band used in ASTM D5594 for EVA with low vinyl acetate content [5].
- Calibration and reporting choices. Different ways of calculating a carbonyl index give different results [9].
- Instrument condition. Drift or faults show up in routine performance tests [3].
- Reference matching. Library results depend on reference spectra recorded with a similar sampling method [11].
Relevant Standards and Methods
The table lists the current editions of the standards cited in this article, as shown on the issuing bodies' pages in October 2026. Editions change, so confirm the current version with the issuing body before citing a standard in a specification.
| Standard | Scope (summary) | Relevance |
|---|---|---|
| ASTM E1252 (2021 edition) | General techniques for collecting infrared spectra used to identify materials [1] | Sampling and collecting spectra |
| ASTM E168 (2023 edition) | General techniques for measuring amounts by infrared [2] | Composition work based on calibration |
| ASTM E1421 (2021 edition) | Level Zero and Level One performance tests for mid infrared FTIR instruments [3] | Instrument performance checks |
| ASTM D5576 (2021 edition) | Structural features of polyolefins and copolymers by FTIR [4] | Branching and structure of polyolefins |
| ASTM D5594 (2024 edition) | Vinyl acetate content of EVA by FTIR [5] | EVA composition |
| ASTM F2102 (2026 edition) | Extent of oxidation in polyethylene for surgical implants [6] | Carbonyl oxidation index |
| ISO 1043 Part 1 (2011 edition) | Symbols and abbreviated terms for basic polymers [7] | Naming materials consistently in specifications |
Industry Applications
Testshine's product information names these application areas for its FTIR instrument: pharmaceutical, chemical, petrochemical, polymer and plastics, food, environmental and biomedical laboratories, plus universities and testing laboratories [15]. Listed polymer and packaging uses include testing of polymer materials such as plastics, rubber, adhesives, asphalt and resins, and testing of food and drug packaging materials. Other listed uses, which are not plastics applications, are screening of organotin compounds in electrical and electronic products and identification of textile fibers [15]. Beyond that list, published studies show FTIR identifying plastics in environmental samples [8][11] and tracking oxidation in medical grade polyethylene [6].
Quality Control and Product Development
- Quality control. Match incoming and outgoing material against reference spectra and keep the spectra as records.
- Process control. Compare parts from different machines or lots to spot a changed material or contamination.
- Comparing materials. Overlay the spectra of candidate resins or suppliers to see chemical differences.
- Research and development. Follow curing, composition or aging through changes in the bands. Testshine lists adhesive curing rate testing among its measurement applications [15].
- Compliance support. FTIR can screen for particular substances, such as the organotin screening listed by Testshine [15], but a screening result is not a regulatory conclusion by itself. Follow the method that the regulation specifies.
Common Testing Challenges
- Very similar plastics. Separating high density from low density polyethylene was the hardest step in the ATR validation study, and its step by step guide identified 78% of ingested polyethylene samples [8].
- Surface effects. ATR spectra may not represent the inside of the material (see above).
- Mixtures and layered products. Spectra can contain overlapping contributions, so a single library match can mislead.
- Nonstandard calculations. Carbonyl indexes from different laboratories may not be comparable unless the method is stated [9].
- Interpretation. A high match score still needs a check of the key bands by a trained analyst.
How to Select the Appropriate Method
| Need | Suitable approach | Related reference |
|---|---|---|
| Fast identity check on pellets or parts | ATR if an accessory is available; otherwise transmission on a pressed film | [8][11] |
| Measuring the composition of a film or plaque | Transmission with controlled thickness and a calibration curve | [2][4][5] |
| Tracking oxidation | Carbonyl band with a defined, documented calculation | [6][9] |
| Unknown material | Library search plus expert review of the key bands | [11][14][15] |
| Instrument suited to the task | Check spectral range, resolution, signal to noise ratio and routine performance tests | [3] |
Before choosing, write down the decision the result will support, such as a pass or fail identity check, a composition limit or a trend in aging. Then select the sampling method and acceptance limits to match.
Specifications of the Testshine TS-20 FTIR Spectrometer
The information below comes only from the TS-20 product page [15]. Read each value together with the conditions stated on that page.
| Parameter | Specification |
|---|---|
| Spectral range | 7800 to 350 cm⁻¹ |
| Resolution | Better than 1.0 cm⁻¹ |
| Signal to noise ratio | 30,000:1 (peak to peak, 4 cm⁻¹, 1 min scan) |
| Wavenumber accuracy | Better than 0.01 cm⁻¹ |
| Transmission accuracy | Better than 0.05 τ% |
| Interferometer | Non orthogonal Michelson |
| Data interface | High speed USB 2.0 (USB 3.0 compatible) |
| Power supply | 100 to 240 V, 50/60 Hz |
| Size / weight | 450 × 350 × 210 mm; 14 kg net |
The page also lists a sample bin of 190 × 160 mm, a warranty of 2 years covering parts and service, and compatibility with Windows XP through Windows 11 [15]. It does not cite specific ASTM or ISO methods for the product, so any claim tied to a method should be confirmed with Testshine.
Conclusion
FTIR gives manufacturers a fast, chemically specific way to confirm that plastic materials are what they should be. Reliable results depend on choosing the right sampling method, controlling thickness and surface condition, comparing against suitable reference spectra and checking the instrument's performance. For measuring amounts and aging, the method and calculation must be stated, because different approaches give different answers [4][5][9]. The strongest verification programs combine documented procedures, current standards and trained interpretation of the key bands, not only software match scores.
Relevant Testshine Product
Bring Reliable FTIR Material Verification to Your Plastics Lab with the Testshine TS-20 FTIR Spectrometer
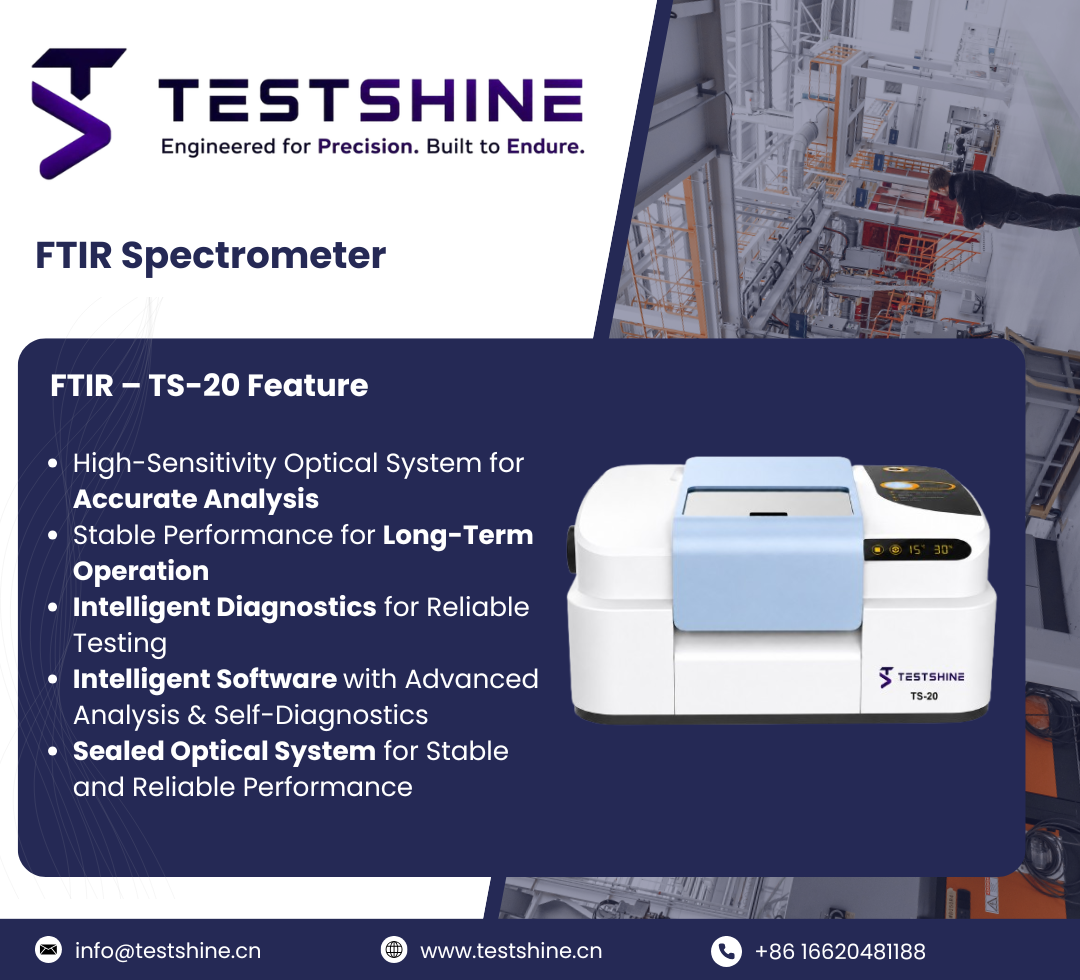
Every step in this article, from confirming resin identity to measuring composition and checking for aging, depends on an instrument that records accurate, repeatable spectra. The Testshine TS-20 FTIR Spectrometer is a Fourier transform infrared instrument that Testshine lists for infrared analysis of organic, inorganic and polymer materials.
Why it fits the plastics verification workflow described above:
- Mid infrared coverage. A spectral range of 7800 to 350 cm⁻¹ spans the mid infrared region of roughly 4000 to 400 cm⁻¹, where most plastic identification is done, as covered in this article.
- Resolution and wavenumber accuracy. Resolution better than 1.0 cm⁻¹ and wavenumber accuracy better than 0.01 cm⁻¹ support the band naming and library matching described above.
- Stated signal to noise performance. A signal to noise ratio of 30,000:1 (peak to peak, 4 cm⁻¹, 1 min scan) is listed with its test conditions, so it can be compared fairly with other instruments.
- Polymer and packaging applications. Listed applications include testing of polymer materials such as plastics, rubber, adhesives, asphalt and resins, and testing of food and drug packaging materials.
- Identification and measurement. Supports comparison against a standard IR spectrum or a search of an infrared spectrum library (approximately 220,000 Sadtler spectra available through the manufacturer), plus measurement applications such as ethylene content in polypropylene and polyethylene and vinyl acetate content in EVA.
- Compact design and easy connection. Instrument size 450 × 350 × 210 mm, 14 kg net weight, high speed USB 2.0 interface (compatible with USB 3.0), Windows XP through Windows 11 compatibility, and a warranty of 2 years covering parts and service.
The TS-20 is listed by Testshine for laboratories in the polymer, plastics, chemical, petrochemical, pharmaceutical, food, environmental and biomedical sectors. The product page does not list ATR or other sampling accessories, so please confirm with Testshine which accessories are available for your configuration.
References
-
ASTM International, "Standard Practice for General Techniques for Obtaining Infrared Spectra for Qualitative Analysis," ASTM E1252 (2021 edition). https://store.astm.org/e1252-98r21.html
-
ASTM International, "Standard Practices for General Techniques of Infrared Quantitative Analysis," ASTM E168 (2023 edition). https://store.astm.org/e0168-16r23.html
-
ASTM International, "Standard Practice for Describing and Measuring Performance of Fourier Transform Mid Infrared (FT MIR) Spectrometers: Level Zero and Level One Tests," ASTM E1421 (2021 edition). https://webstore.ansi.org/Standards/ASTM/ASTME1421992021
-
ASTM International, "Standard Practice for Determination of Structural Features in Polyolefins and Polyolefin Copolymers by Infrared Spectrophotometry (FTIR)," ASTM D5576 (2021 edition). https://store.astm.org/d5576-00r21e01.html
-
ASTM International, "Standard Test Method for Determination of the Vinyl Acetate Content of Ethylene Vinyl Acetate (EVA) Copolymers by Fourier Transform Infrared Spectroscopy (FTIR)," ASTM D5594 (2024 edition). https://store.astm.org/d5594-18ar24.html
-
ASTM International, "Standard Guide for Evaluating the Extent of Oxidation in Polyethylene Fabricated Forms Intended for Surgical Implants," ASTM F2102 (2026 edition). https://store.astm.org/f2102-17r26.html
-
ISO, "Plastics: Symbols and abbreviated terms, Part 1: Basic polymers and their special characteristics," ISO 1043 Part 1, 2011. https://www.iso.org/standard/50590.html
-
M. R. Jung et al., "Validation of ATR FTIR to identify polymers of plastic marine debris, including those ingested by marine organisms," Marine Pollution Bulletin, vol. 127, pp. 704 to 716, 2018. doi:10.1016/j.marpolbul.2017.12.061. https://pubs.usgs.gov/publication/70197549
-
J. Almond, P. Sugumaar, M. N. Wenzel, G. Hill and C. Wallis, "Determination of the carbonyl index of polyethylene and polypropylene using specified area under band methodology with ATR FTIR spectroscopy," e Polymers, vol. 20, no. 1, pp. 369 to 381, 2020. https://www.doi.org/10.1515/EPOLY-2020-0041
-
J. V. Gulmine, P. R. Janissek, H. M. Heise and L. Akcelrud, "Polyethylene characterization by FTIR," Polymer Testing, vol. 21, pp. 557 to 563, 2002. https://www.sciencedirect.com/science/article/abs/pii/S0142941801001246
-
S. Primpke et al., "Critical Assessment of Analytical Methods for the Harmonized and Cost Efficient Analysis of Microplastics," Applied Spectroscopy, 2020. https://doi.org/10.1177/0003702820921465
-
P. R. Griffiths and J. A. de Haseth, Fourier Transform Infrared Spectrometry, 2nd ed., Wiley, 2007, ISBN 9780471194040. https://www.wiley-vch.de/en/areas-interest/natural-sciences/fourier-transform-infrared-spectrometry-978-0-471-19404-0
-
B. Stuart, Infrared Spectroscopy: Fundamentals and Applications, Wiley, 2004, ISBN 9780470854280. https://www.wiley-vch.de/en/areas-interest/natural-sciences/infrared-spectroscopy-fundamentals-and-applications-978-0-470-85428-0
-
National Institute of Standards and Technology (NIST), "NIST Chemistry WebBook, SRD 69: Infrared Spectra (evaluated Coblentz Society collection)." https://webbook.nist.gov/chemistry/
-
Testshine, "FTIR Spectrometer TS-20," product page, accessed October 2026. https://testshine.cn/products/analytical-instruments/ts-20-ftir/